


 Epixel Research: Fairness and Growth Studies
Data has become an important factor that influences business decisions and today, and everyone in the business has access to a lot of data. In fact, there is an oversupply of data today but that has not made decision making any easier. Distributors in direct selling can easily track important business metrics like daily sales, customer acquisition costs, retention rates, rank advancements, and commission data through their portals and dashboards. However, many direct selling leaders are not really confident about the current health of the business.
Technology has helped them consolidate business performance data into insights but countless charts and reports often make it difficult to identify the insights that actually mark the growth and health of a business. Direct selling is growing into an expansive industry with a recently reported global retail sales of $164 billion and supports 104 million independent representatives. When metrics are overlooked or misinterpreted, it can create serious consequences that impact growth such as declining distributor activity, inefficient payouts, or slowing network growth and trust within the network.
The concept of MLM Health Score (MHS) focuses on addressing this challenge by offering companies a single score that indicates the overall health of a direct selling organization. Through this article, we have attempted to evaluate how MHS influence growth, payout efficiency, and distributor equity.
Direct selling industry needs a standardized health metric
Compare the direct selling industry with other peer industries such as ecommerce, SaaS, or credit bureaus. Each has its own performance metrics. When annual recurring revenue and net dollar retention determines the success of SaaS companies, ecommerce finds their numbers by dividing lifetime value by customer acquisition cost, and credit bureaus have FICO score. But direct selling does not have this kind of an easy to interpret metric.
The absence of a standardized metric impact investor acceptance because private equity firms and venture capitalists cannot estimate direct selling returns accurately. Without a means to define fairness level, direct selling companies undergo regulatory scrutiny for their payout structures, recruitment incentives, and income distribution. If companies have an evidence-backed health score, they can provide exactly the kind of data regulators are looking for. Direct selling distributors look for fair growth and earning opportunities. A company with a credible health score becomes highly attractive to distributors.
Similar industries use Net Promoter Score (NPS) and ESG ratings to understand business health and MLM Health Score (MHS) aims to function as one such metric that would determine the health of direct selling businesses.
The numbers behind the direct selling industry
Direct selling industry successfully withstood the pandemic but is still facing structural challenges related to growth, retention, and compensation fairness. This brings out the imminent need to have a metric that speaks about the long-term sustainability of a direct selling business.
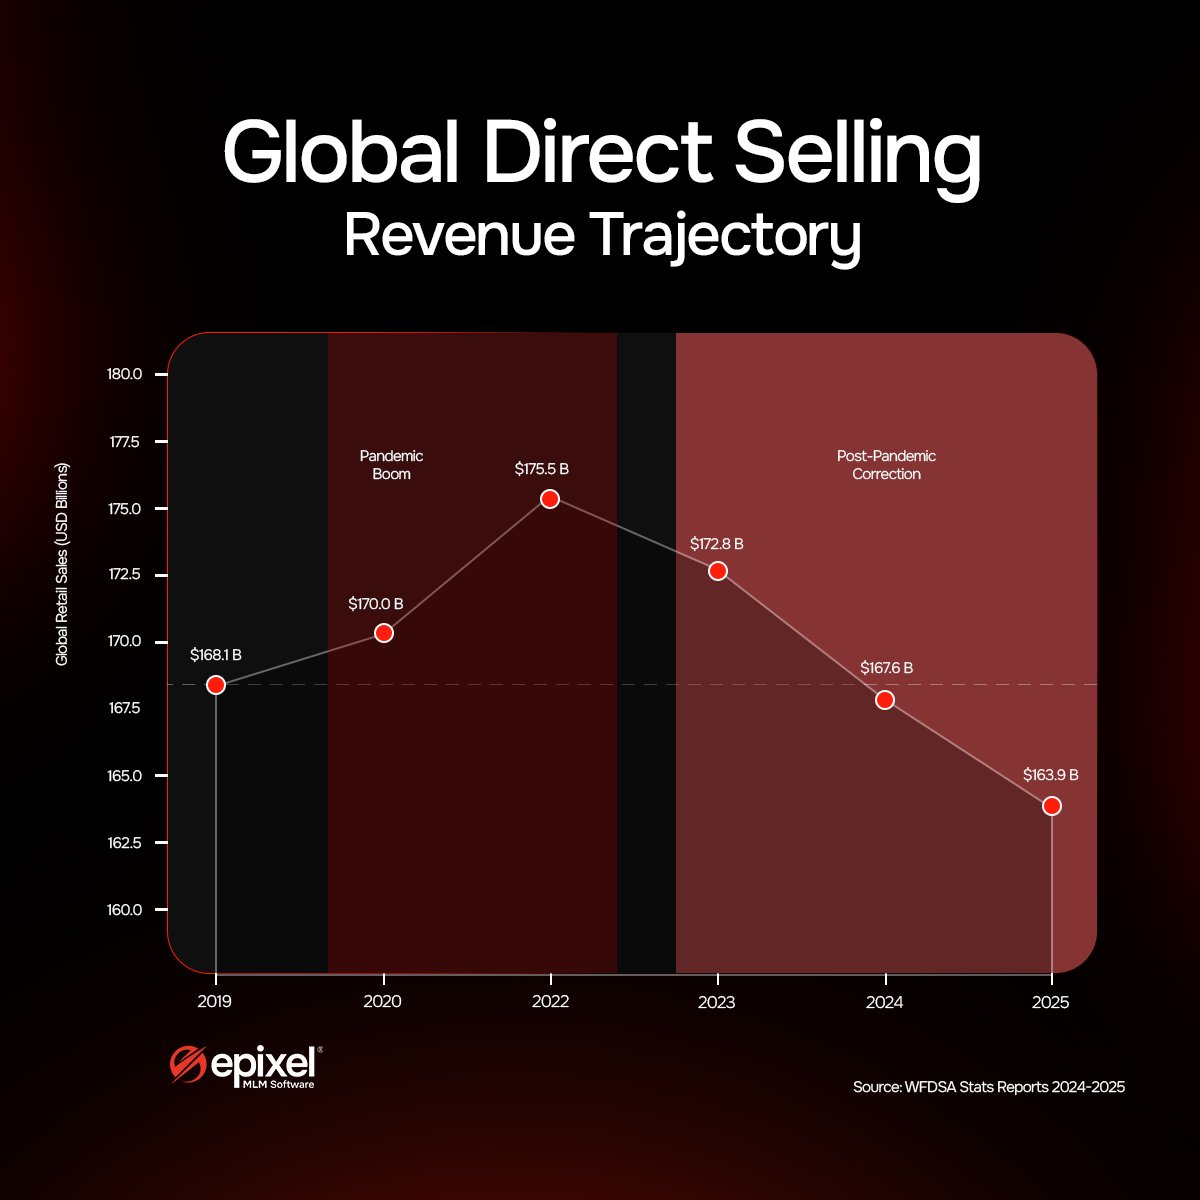
Global direct selling revenue trends
During the pandemic, many people chose to stay home looking for remote job opportunities. This trend accelerated sales in direct selling with the industry generating $175.5 billion in 2021, a 4.4% increase from $168.1 billion in 2019. The pandemic peak slowly faced a gradual decrease in retail sales revenue of $172.8 billion in 2022, $167.6 billion in 2023, and about $164 billion in 2024.
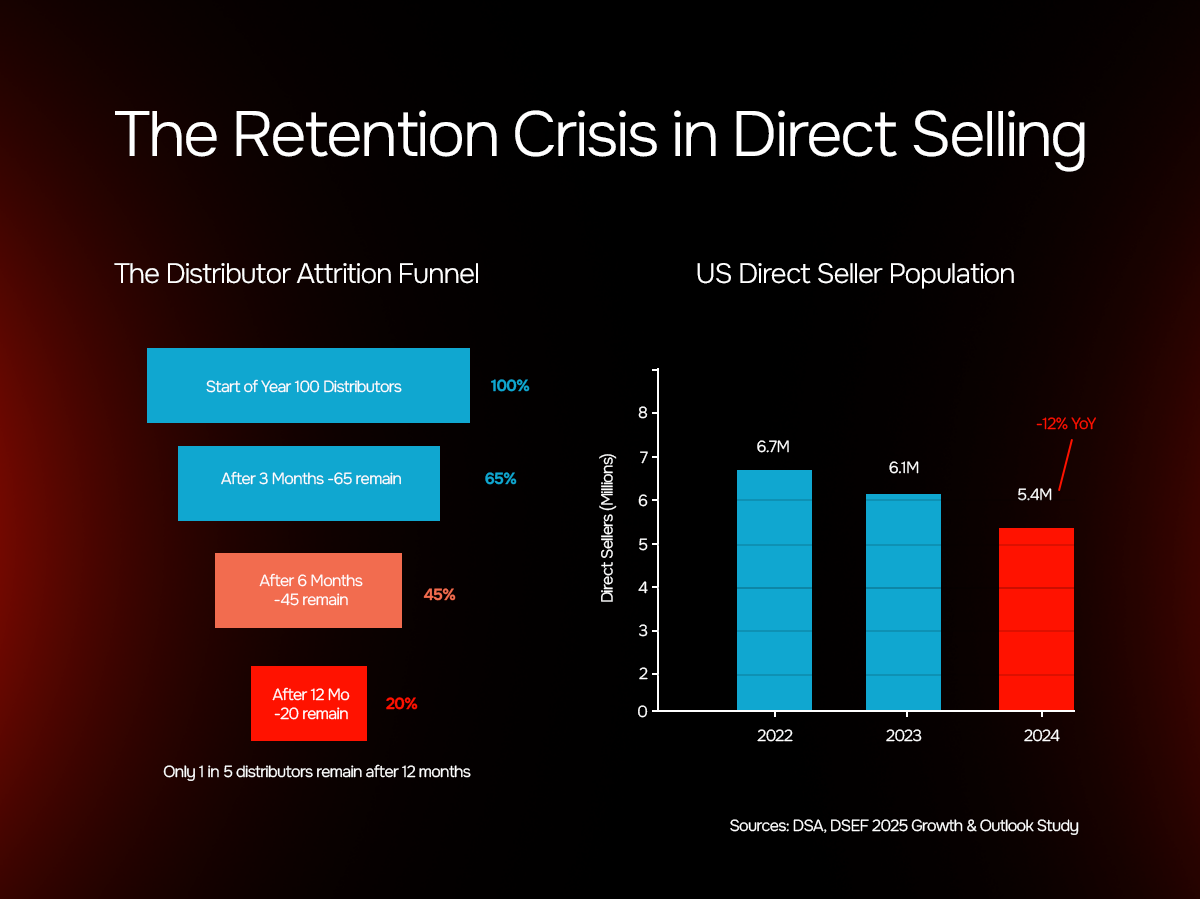
The US direct selling industry in 2024 recorded $34.7 billion in 2024 which is a $2 billion cut down from 2023. The direct seller numbers also suffered a decline of 12% and ended at 5.4 million. Even so, nine US states California, Florida, Georgia, Illinois, New York, North Carolina, Ohio, Pennsylvania, and Texas got into the list of billion-dollar markets. The decline in the post pandemic period was due to temporary participants leaving the industry and not because customer demand for direct selling products dropped.
The retention crisis
Distributor and customer retention has always been a challenge for direct selling businesses. Industry studies reported that annual distributor retention rate falls between 10-20% and overall turnover rate can reach 50-75%. That is, a company with 100,000 active distributors with a 60% churn rate must recruit 60,000 new distributors each year to maintain its current network size.
Realities in compensation payouts
Compensation structures is an important factor that determines company profitability, distributor motivation, and regulatory scrutiny. Industry data in the past years point out that companies reserve about 40% to 60% of revenue to compensation payouts. In the case of sustainable compensation plans the percentage falls between 42% to 46%. The income distribution is uneven because only about 25% of participants report earning a profit and roughly 4% earn more than $25,000 annually. This forms the basis of regulatory scrutiny and income distribution concerns within the industry.
Eliminate risks and inaccuracies in your MLM compensation plan using a free.
The three levers that define the MLM Health Score
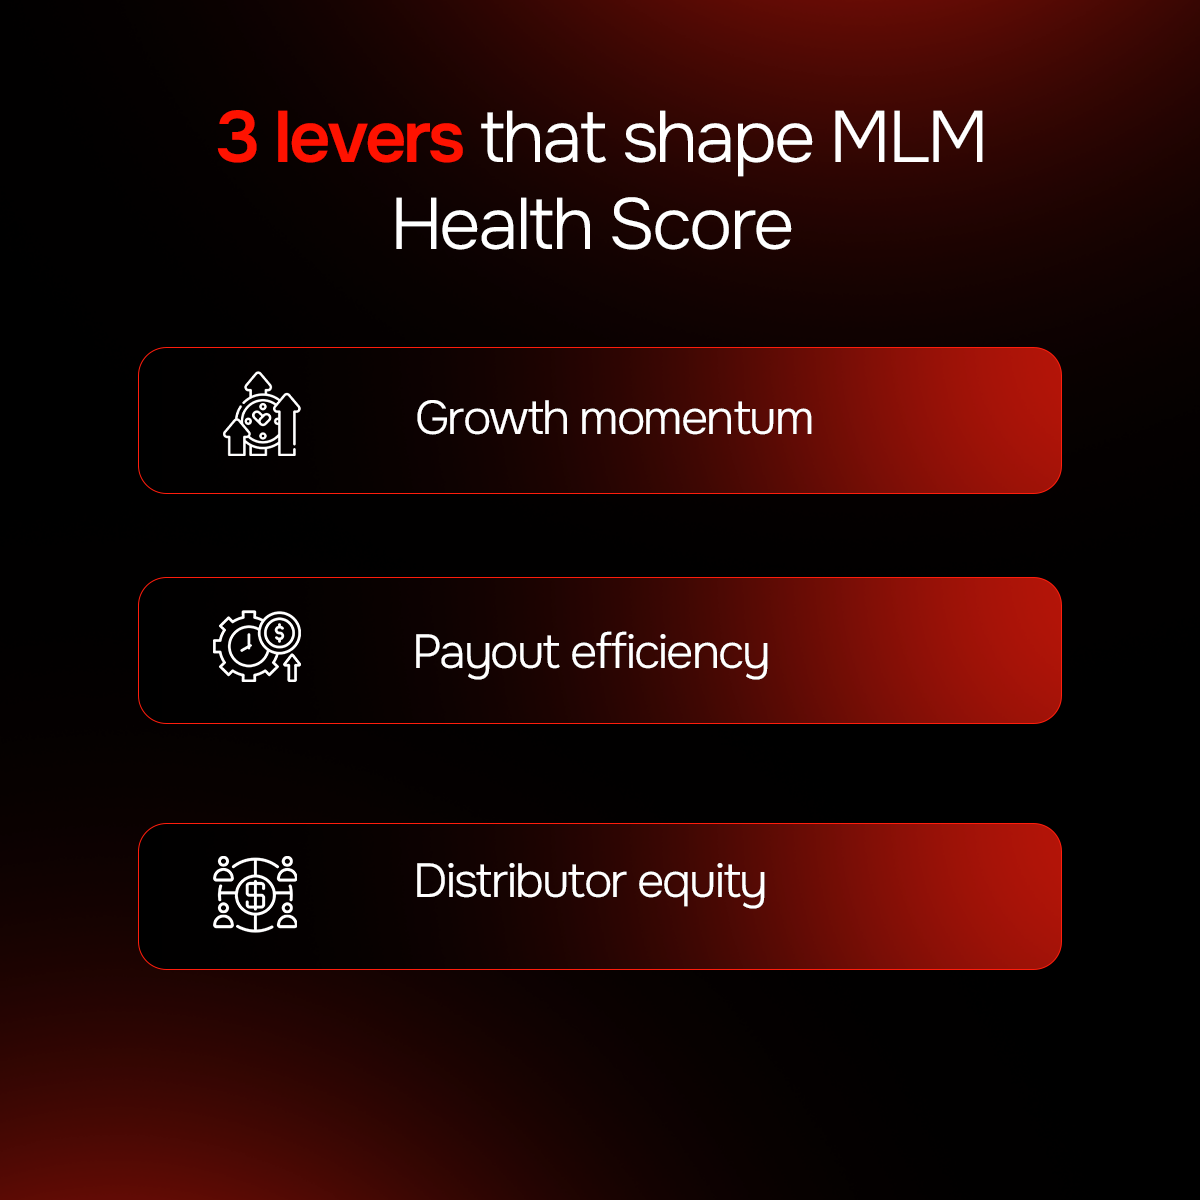
MHS of a direct selling company is measured by assessing the performance of the company across aspects like growth momentum, payout efficiency, and distributor equity. Each of these levers is an important aspect of the business and is measured using several smaller metrics.
The score is calculated using the formula below.
MHS = (w1 * Growth Momentum) + (w2 * Payout Efficiency) + (w3 * Distributor Equity)
Each lever has a weight (w) depending on its importance. The scores derived are expressed on a 0 to 1000 scale.
| SCORE INTERPRETATION GUIDE | |||
|---|---|---|---|
| Score range | Rating | What it means | Recommended Action |
| 800-1,000 | Best-in-Class | Excellent performance across all three levers | Maintain momentum and transparent score disclosure |
| 600-799 | Investment grade | Above-average performance with opportunities for improvement | Focus on improving the weakest lever |
| 400-599 | Developing | Uneven performance across all three levers | Evaluate each driver and prioritize actions that bring immediate improvements |
| 0-399 | Needs attention | Multiple structural issues affecting performance | Conduct a full MHS review with expert guidance |
Lever 1: Growth momentum
This lever analyzes the growth rate and the factors that are driving the growth. It does not measure revenue alone. It checks whether the growth is influenced by active distributors and product innovations. The sub-metrics within this lever are 12-month top-line compound annual growth rate, net active distributor growth, and new-product revenue share.
| Sub-metric | The importance | Benchmark | Weight |
|---|---|---|---|
| 12-month top-line CAGR | Core expansion velocity | Median ~8% | 35% |
| Net active distributor Growth | Field engine health | Median ~5% | 35% |
| New-SKU revenue share | Innovation vitality | Median ~27% | 30% |
All three sub-metrics are equally important and tracking or ignoring just one can be misleading. A company can increase its top-line revenue through aggressive promotions and pricing but if the active distributor numbers are declining, it shows that growth is purchased and not naturally earned. Each sub-metric has to be correctly monitored and optimized at the right point so as to complement the overall growth momentum.
Lever 2: Payout efficiency
The second lever analyzes the payout process for fairness and efficiency. The score is a reflection of the efficiency of the company in managing large distributor networks and their payouts. The three sub-metrics it relies on for score calculation are payout ratio, payout volatility, and CAC payback
| Sub-metric | Definition | Safe zone | Weight |
|---|---|---|---|
| Payout ratio | Total commissions as a percentage of net revenue | 42–46% | 40% |
| Payout volatility | Variation in payout ratio over eight quarters | < 1.5 pp | 30% |
| Payback on CAC | Time required to recover new distributor acquisition cost | < 5 months | 30% |
When the payout ratio to revenue increases, it can reduce profits and indicate that the brand is overspending on promotional incentives. When the payout ratio decreases, it shows that distributors are underpaid, which in turn leads to higher attrition rates. Variation in payout ratios can create uncertainty in income, reduce distributor confidence, and can even accelerate distributor attrition. Monitoring payback on CAC can reveal how soon can the costs related to acquiring a new distributor be covered. Higher payback periods put the company at risk by delaying the recovery of distributor acquisition costs.
Lever 3: Distributor equity
It measures if the company has been fair in providing business opportunities and income for all distributors. Four sub-metrics that measure distributor equity score are Gini Coefficient of income, active days ratio, Churn-adjusted NPS, and Downline Diversity Index.
| Sub-metric | What it tests | Sector median | Weight |
|---|---|---|---|
| Gini Coefficient of income | Fairness of earnings distribution | ~0.62 | 25% |
| Active days ratio | Level of distributor activity | ~31% | 25% |
| Churn-adjusted NPS | Distributor loyalty | ~+24 | 25% |
| Downline Diversity Index | Geographic and demographic details of distributors | ~0.71 | 25% |
Gini coefficient measures income inequality within a population. The sector median for direct selling falls at around 0.62 which indicates that the industry’s income distribution is unequal compared to most national economies and there is still room for improvement. Direct selling companies can lower income inequality by introducing small bonuses for new distributors, guaranteed income opportunities at each rank, and a transparent income disclosure. With this, Gini coefficient improves and so does MHS score.
In the same way, active days ratio when combined with churn data, it reveals distributor engagement and loyalty. Churn-adjusted NPS takes feedback from distributors who have already left. This metric removes survivorship bias and provides an accurate view of pure distributor sentiment.
Consolidating raw data into a single score
The MHS has several metrics but each metric is represented in different units such as growth rate is shown as a percentage, the Gini coefficient is scored from 0 to 1, and Net Promoter Score from –100 to +100. This makes it difficult to do a score comparison.
Standardizing with z-scores
The MHS framework converts different sub-metric scores into a z-score which shows if the company’s performance is above or below industry average. The z-score is calculated by the distance of a company’s value from sector mean divided by the sector standard deviation.
For example, a score of +1 means that the company is performing above industry average and a score of –1 means it performs below average. This standardization places all metrics on a common scale and makes it easier to combine.
Calculating the final MHS
Once every metric is converted to a z-score, the values are combined based on predefined weights and their importance in contributing to long-term business health. The weights are decided through discussions by field leaders, executives, and compensation experts. The final score is then converted into a 0-1000 scale so it is easier to interpret.
This scoring method offers transparency into the performance of each sub-metric so that companies can easily identify the ones that are influencing the final MHS.
Sensitivity analysis and decision making with MHS
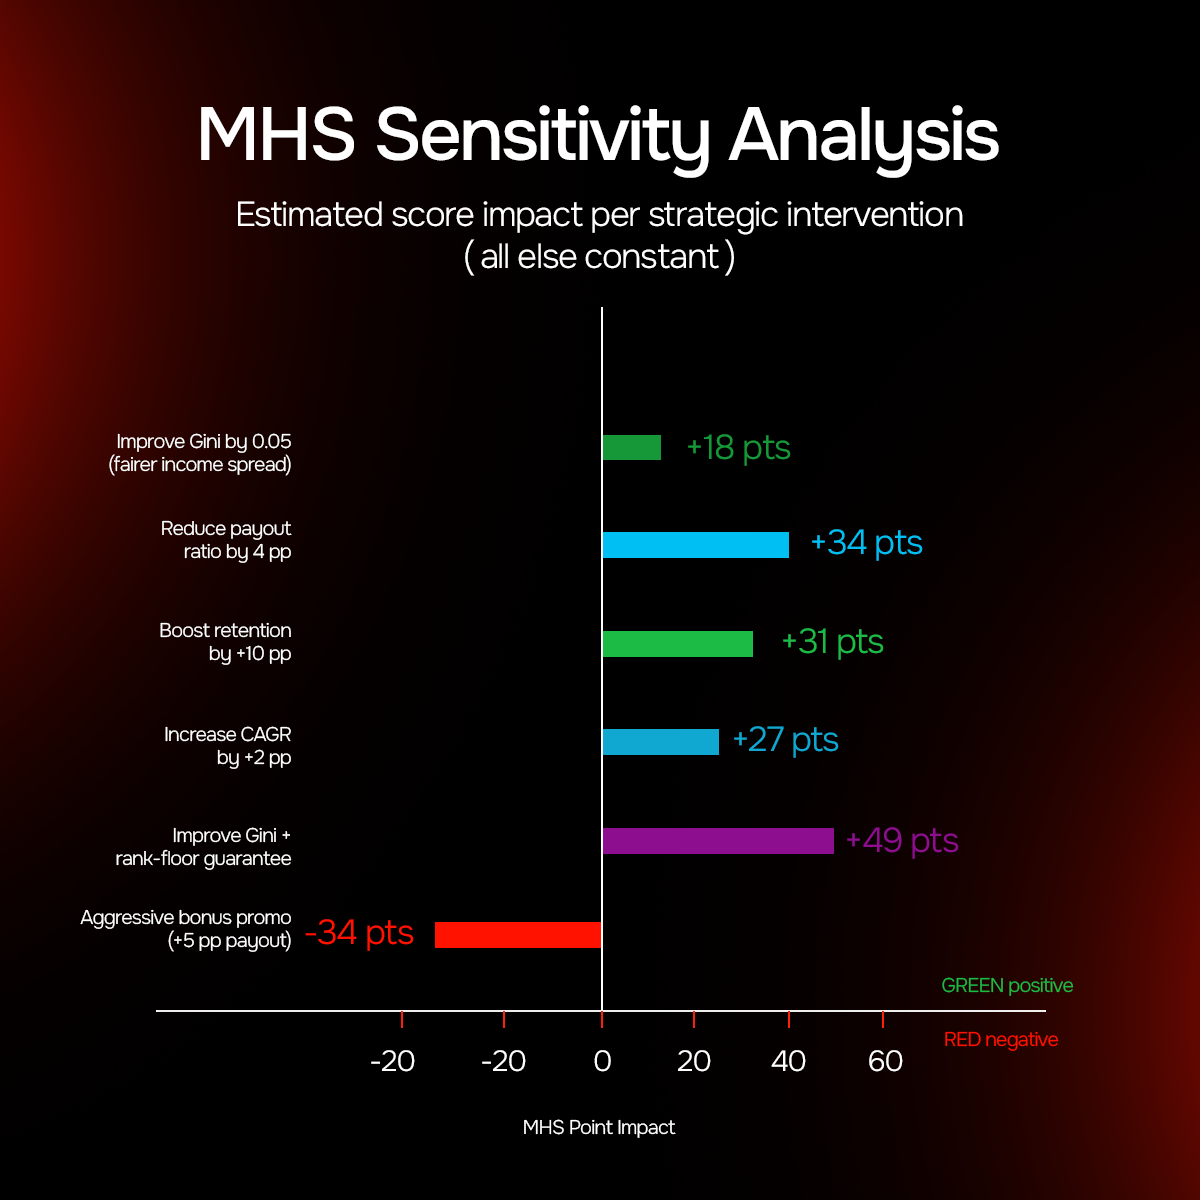
The sensitivity analysis module in MHS is a useful decision making tool for executives as it lets them try variations in the three levers and see the impact it would bring to the total score and to the business growth.
| Scenario | Lever affected | MHS impact | Strategic implication |
|---|---|---|---|
| +2 pp top-line CAGR | Growth momentum | +27 points | Validates market expansion investment |
| +5 pp payout ratio | Payout efficiency | –34 points | Reveals the consequences of aggressive pricing and promotions |
| –0.05 Gini improvement | Distributor equity | +18 points | Measures the benefit of fair income distribution |
| +10 pp distributor retention | Growth + Equity | +31 points | Shows the increasing value of distributor retention |
These simulations and sensitivity analysis highlight the true value of MHS as a decision making tool. The data-driven insights thus derived become a reliable guide to optimize performance decisions in direct selling.
Distributor equity: An influential factor in distributor retention
Many direct selling companies invest lavishly in recruiting new distributors but underinvest when it comes to retention and support. Distributor retention data in the direct selling industry shows that annual distributor turnover ranges between 50% and 75%. This means that companies spend more on replacing lost distributors every year. When newly recruited distributors leave, the investment on acquisition translates into loss. This situation makes distributor equity one of the important yet underestimated levers of MHS.
The US market data in 2024 underlines this. The number of direct sellers declined from 6.1 million 2023 to 5.4 million, a 12% drop but retail sales fell only by 5.5%. This points to the fact that even when distributors left, the ones that stayed active became more productive.
MLM Health Score framework analyzes these patterns through metrics such as income distribution, distributor engagement, and loyalty. By establishing fairness and equity in compensation, onboarding, and training, companies can build better distributor relationships that favor long-term growth.
Governance and accountability
The MHS becomes credible only when the framework that governs it is transparent and accountable. Proper governance ensures that the score is accurate, fair, and not manipulated.
Quarterly updates
MHS has to be updated every quarter, about 15 days after the closure of financial reports. This is to ensure the accuracy of data and give enough time to verify its accuracy.
Independent verification
All the data used for the calculation of the score should be audited by an external audit firm. This can prevent intermediate members manipulating numbers and ensure that the score is the reflection of real business health.
Version control
If, at any time, the company chooses to change how the score is calculated or weighted, it must be approved by the board and documented because keeping the scoring system consistent and comparable is important for future references.
Regulatory access
Companies can provide anonymous metric data on request from regulators. This clearly conveys the fairness and accountability of companies and their processes.
Proper governance and accountability are practices that build trust among regulators and investors because the MHS shows that the company prioritizes transparency and responsibility as a continuous process, not a one-time show.
The MHS public leaderboard and private analytics portal
A public leaderboard with MHS lists top-performing direct selling companies. Businesses can opt in or out of revealing their names and scores. The purpose of the leaderboard is to let distributors, investors, and analysts quickly compare the health of different companies. This also cultivates a healthy competition as companies with strong scores can flaunt their performance and others can work to improve their scores.
Direct selling companies get access to a secure private portal which shows the detailed data and calculations behind the score along with trends in key metrics, downloadable reports, and tools to simulate business decisions.
MHS implementation in 12 weeks
The MHS framework is not complicated to adopt because most of the required data already exists in company systems. The resources are allocated strategically, and the complete implementation is designed to be completed in three months.
| Week | Milestone | Owner | Result |
|---|---|---|---|
| 1 | Identify KPIs and data source | Data and strategy | Confirmed metrics and data sources |
| 2–4 | Data extraction and cleaning | Business Intelligence | 12-quarter data collected and cleaned |
| 5 | Allocating weightage to each metric | Executive Committee | Governance documentation |
| 6–7 | Model testing and audit | Analytics | Initial MHS with confidence intervals |
| 8 | Dashboard and sensitivity analysis tool | Product | Staging portal ready for review |
| 9–10 | Board presentation and feedback | CFO | Feedback analysis and weight adjustments as needed |
| 11 | Public score release | Communications | PR brief and investor materials |
| 12 | Private portal launch | Customer Success Team | Distributor communication tools and insights |
The resource requirement for implementation is 0.8 full-time-equivalent data engineer and 0.5 FTE analyst for the initial two months. Most companies only need a small analytics team because 80% of the required data already exists in their ERP and commission systems. Surveys and platform analytics will provide the remaining 20% of distributor sentiments and activity metrics.
Strategic benefits of MHS
MLM Health Score is more than a metric that measures organizational health. When implemented across the organization, it turns beneficial across four business areas:
- Investor relations: Investors can get a quick overview of the company’s health. A presentation slide with MHS reduces information asymmetry and puts the company in better financing terms.
- Distributor recruiting: A strong MHS easily attracts more distributors because it shows that the company is fair and growing. Millennials and Gen Z prefer data as proof before making a choice.
- Mergers and acquisitions: MHS becomes a strong evaluation point in acquisition discussions. Acquirers can know the health and growth potential of a company through transparent MHS reporting.
- Regulatory confidence: Fairness and equity are accurately measured through MHS metrics such as Gini coefficient and churn-adjusted NPS. It shows regulators that the company is treating distributors fairly with fair income standards. Sharing these metrics can make it easy for the company in getting licensing approvals and reduce regulatory risks.
Discover how we build resilient businesses with advanced MLM functionalities


Conclusion: Measure what matters
And what really matters is the company’s growth and its network’s health. MHS provides companies and their stakeholders with the current state and future possibilities of growth. The framework will further advance into an intelligent concept in the future with real-time scoring, predictive modelling, richer industry benchmarking, and alignment with ESG standards. It has already taken place in corporate decision making and establishing investor relations.
Modern analytics systems will enhance the power of MHS in forecasting risks and opportunities earlier. The clarity MHS brings through the three levers is beyond compare as it reflects the fundamental dynamics that determine whether a direct selling company can sustain for the long term. When every lever and the sub-metrics embodied stay balanced, companies can achieve consistent growth along with distributor trust and operational discipline.
Data sources and references
The data in this article is sourced from World Federation of Direct Selling Associations (WFDSA), 2024 and 2025 stats reports, Direct Selling Association (DSA), and 2025 Growth and Outlook Study, Direct Selling Education Foundation (DSEF), US Industry Performance Report 2024, Direct Selling News, and 2023 Billion Dollar Markets Report. Industry compensation benchmarks are sourced from MLM.com and independent compensation plan consultants. Retention and churn benchmarks are taken from DSA studies and published industry analyses.


Leave your comment
Fill up and remark your valuable comment.