

















 Epixel Analytics: Growth and Influence Insights
Enthusiasm and relationships have been defining the vibrance of direct selling as a marketing model, in the past and even now. In 2026, data analytics, operational excellence, and financial discipline are enhancing the industry’s performance.
Direct selling industry in the past decade has seen an increasing growth rate. Even in the pandemic years, the industry managed to adapt to economic turmoil and in the following year it sprang to a new growth phase.

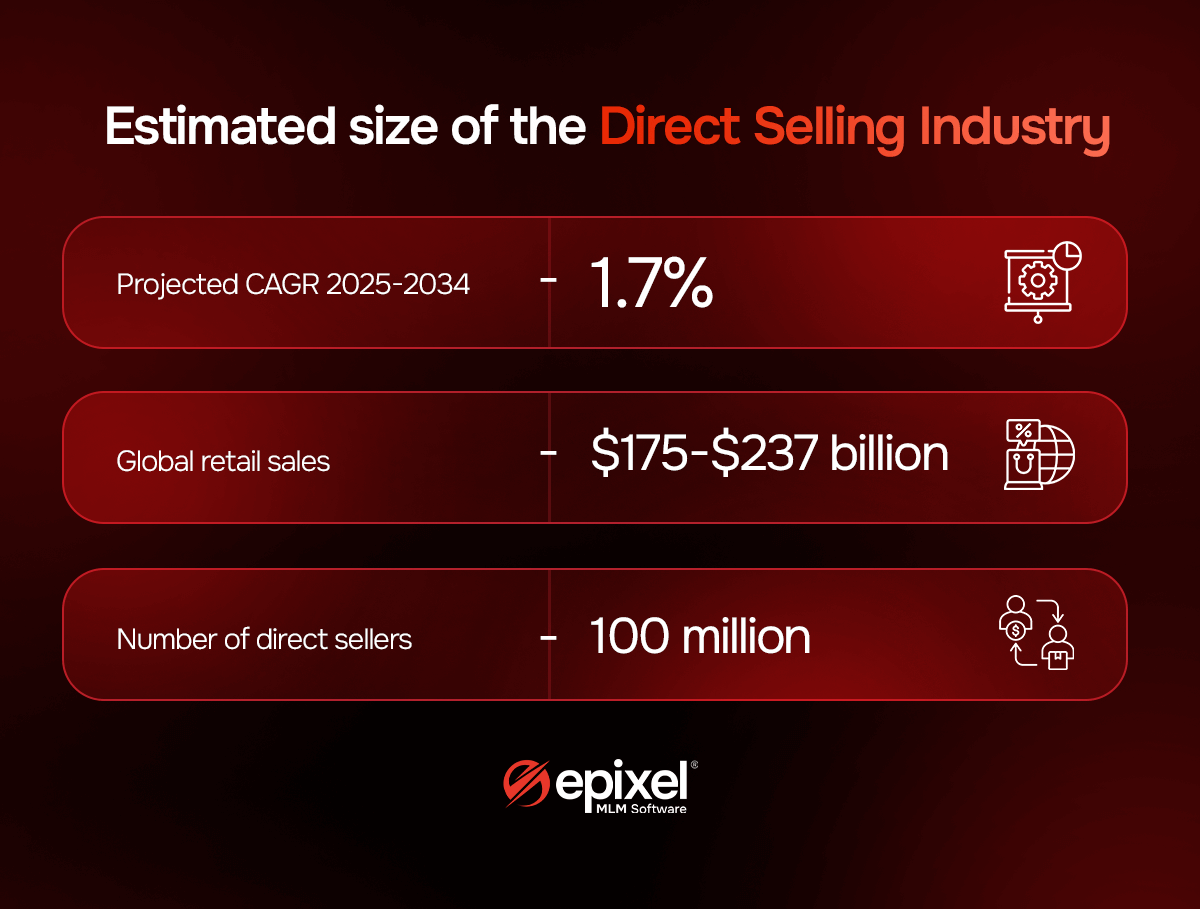
The global direct selling market in 2026 is estimated between $175 and $ 237 billion with over 100 million direct sellers. The health and wellness sector, the leading in the industry, is fast pacing toward $7 trillion. However, traditional practices and age old direct selling tactics which once laid the foundation for the growth of existing leaders, are getting outdated and inefficient in today’s economy. The past has been an era of easier recruitment, longer retention, and generous commissions, all with low cost investments. But, today’s market needs an analytical and sustainable version of the model, that brings with it growth, trust, and loyalty.
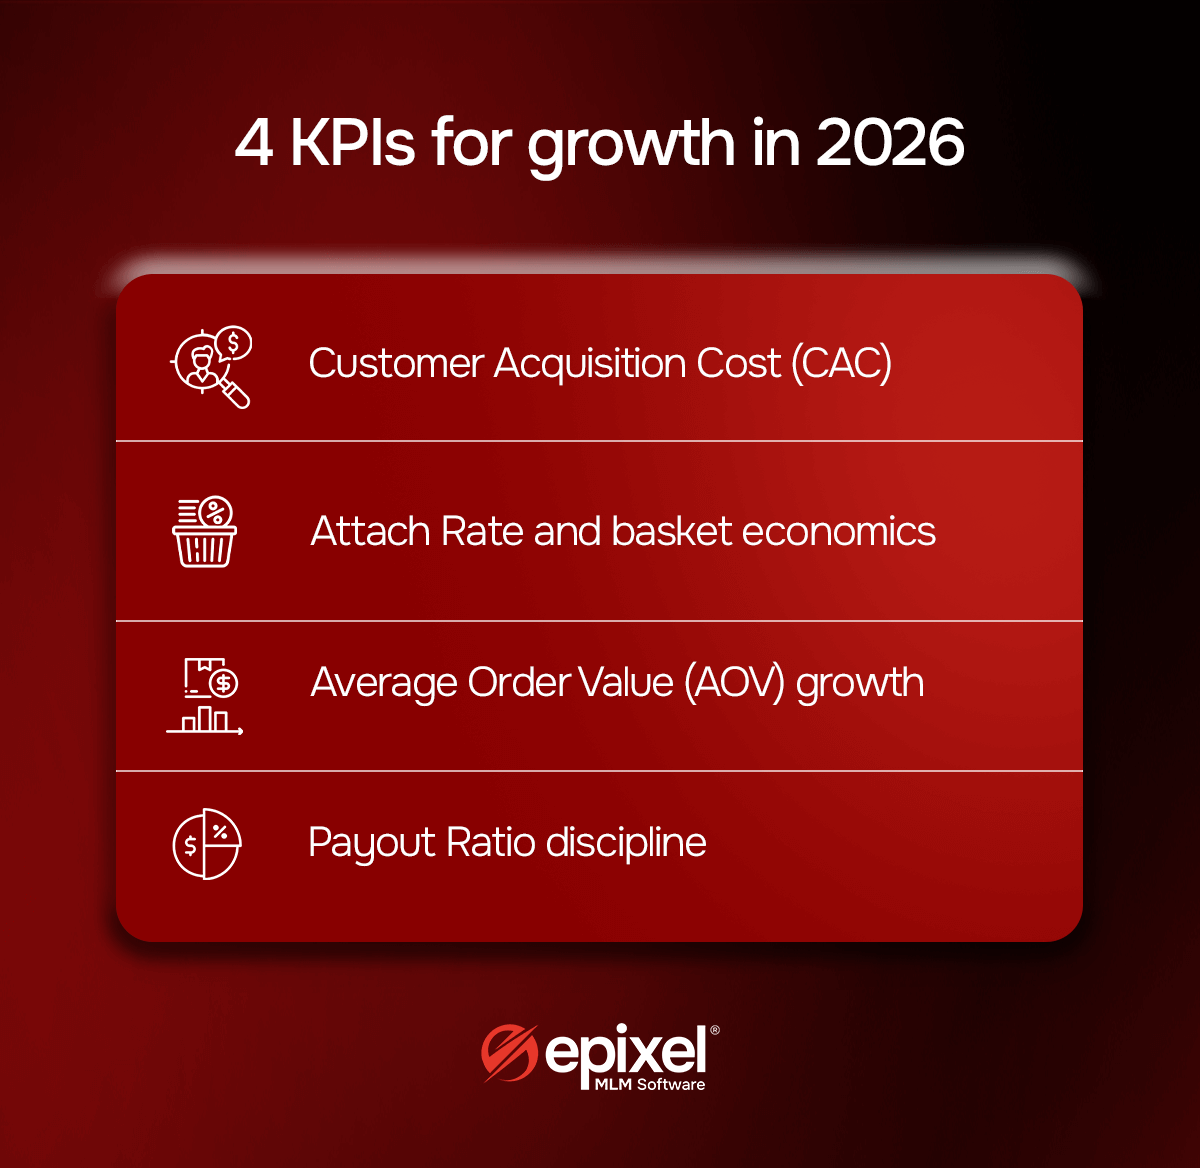
This article analyzes the present state of the direct selling industry through available stats and facts to present companies and their leadership with four important KPIs—Customer Acquisition Cost (CAC), Attach Rate and basket economics, Average Order Value (AOV) growth, and Payout Ratio discipline. Each KPI represents key areas where decisions in the next two quarters will have positive or negative effects on the business for the long term.
We have not conducted specific surveys or polls. Our findings are based on available industry data from organizations like Direct Selling Associations and cross-sector comparisons from other consumer-based businesses. In instances where different reports showed different numbers, we choose a range. The insights in the article are meant to guide leaders in decision making and are not meant to be financial forecasts.
The present market condition
When analyzing the past decade, we clearly see the growth graph fluctuating even though not drastically. The market is recovering from the pandemic shock, regulations are tightening, and process costs and investments are increasing.
Growth is in reset mode
The direct selling salesforce in 2024 was 104 million, a flat growth compared to 2023. This is also 4% below the pre-pandemic salesforce total of 109 million in 2019. This indicates that distributor recruitment numbers are falling and could be a result of the post pandemic normalization. People no longer need a work from home flexibility which brought so many into the industry during the pandemic. What they need instead is a stronger value proposition.
Most estimates tag health and wellness category as the leading one with 35-38% expected revenue contribution, followed by cosmetics and personal care and household goods. An interesting and insightful fact to note here is that these are all repeat purchase categories where the depth of distributor-customer relationship decides whether a first order becomes a lifetime customer.
Regulatory pressures are rising
The regulatory climate in 2026 is heating up, not cooling down. Regulatory scrutiny is focused on compensation plans, income claims, and the percentage of revenue derived from genuine customer sales. Industry participants and regulatory bodies are closing in on practices that may harm consumer interests and privacy.
Companies that are customer-centric with transparent operations are safe and set for growth. Those who are prioritizing recruitment and unfair trade practices are bound to attract scrutiny and penalizations.
The four KPIs discussed here also cover the compliance aspect. Customer acquisition strategies with misleading product or income claims and payout structures that reward distributors for recruitment over sales have become serious regulatory concerns.
Capital is more expensive
Interest rates have increased after a short-term dip followed by the pandemic. Borrowing money or raising funds has become more expensive than before. Direct selling companies planning investments in technology platforms, product development, or distributor training will need to show clear improvements faster than in the past.
Investing first and reaping the benefits later does not fit into today’s financial expectations. Finance teams and investors look for clear ROI promises to release funds.
Four KPIs to design your growth strategy in 2026
These Key Performance Indicators will help direct selling leadership teams to efficiently allocate capital, improve performance, and secure a competitive advantage in 2026.
Customer Acquisition Cost
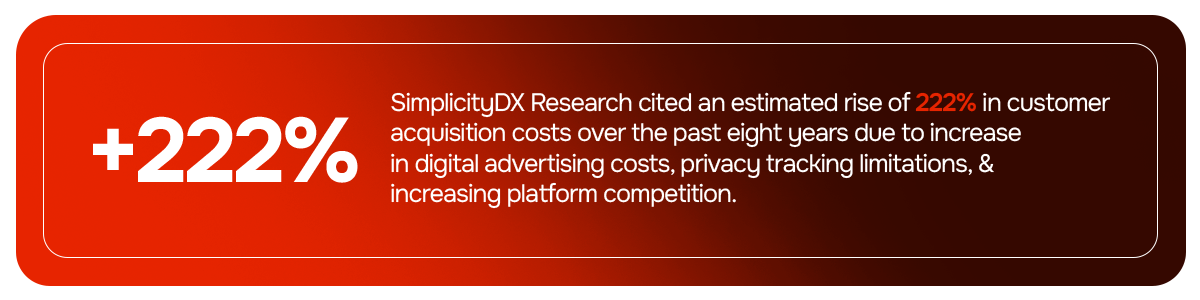
Customer acquisition costs have been increasing for every business investing in digital marketing channels for growth. Multiple industry reports point to the fact that CAC has increased by 200% in the past eight to nine years for consumer-centric businesses. When it comes to direct selling, this increase in cost is a bit different. Direct selling companies do not invest so much on digital advertising to reach customers but competition is a common factor. It has become all the more difficult to earn people’s attention, trust, and time.
CAC in direct selling is a mix of two different cost components. One is the cost of getting a regular customer and the other is the cost of recruiting a distributor. Here again, the distributor is apparently a customer who buys products for personal use. Hence, customer acquisition strategies and cost for multi-level marketing should be planned carefully.
- The two types of costs must be separated.
- Customer and distributor personas must be created.
- Cost optimization strategies for the two groups must be specific to each group.
- The payback time for the two groups must be tracked regularly.
Low CAC can be misleading
When customer acquisition costs stay stable or go down, leaders think that their marketing and recruiting methods are becoming more efficient. But a lower CAC can sometimes be lower spending which shrinks the recruitment funnel and stops attracting valuable people to the network. In order to build an efficient CAC strategy, companies must follow the methods that leading MLM companies are using.
- Build acquisition strategies using zero-party data, referrals, and targeting high value prospects.
- Focus on the quality of people to increase ROI and lifetime value.
A strategic insight
Acquire distributors or customers who will stay active even after the first 12 months.
Advantage of referrals as an acquisition channel
Studies conducted across the industry show that customers or distributors who come through referrals make faster first purchases, stay longer, and spend more over time. So, the truth is referred customers are more loyal and valuable than those acquired through paid advertising.
The personal relationship benefits in direct selling are more in favor of the referral channel. But companies think that referrals come in organically instead of designing a proper system. Referral programs have to be built into the system as a goal for distributors and special incentives for referrals to make the most out of this acquisition channel.
- Measure referral rate every quarter.
- Create special incentives.
- Set up an easier referral process with apps and platforms.
Strategic decision #1: Make lifetime value the topmost priority in your acquisition strategy
Investments made to boost CAC should be measured not by the number but by the value. Every spend made should be able to answer these three questions:
- How long does it take to recover our acquisition cost?
- Are we measuring success based on just 90-day retention, or true 12-month value?
- Are referrals performing better than paid recruits?
Direct selling companies must segment their CAC spends by acquisition channel, distributor persona, and retention rates. Because one channel may look cheaper but bring low quality recruits with lower lifetime value. Acquisition efficiency can be tracked by setting a defined period to reclaim the acquisition costs. However, referrals should be set as the primary channel and paid digital marketing as just a support channel.
Attach rate and basket economics
Ask a hundred direct selling executives which metric they track rigorously. The answer would be revenue, active distributor count, rank advancement, and retention rate. Only a few would mention the attach rate, the average number of products in a single customer order. It is the most overlooked metric in determining customer lifetime value.
Attach rate can increase profit margins because when a customer adds more products in a single order, the cost of picking, packing, and shipping is fixed for a single order. So, the first product carries all the cost and every additional product in the order contribute better to the margin increase.
Customers who buy more products in a single order are more loyal to the brand and hence are more likely to stay longer.
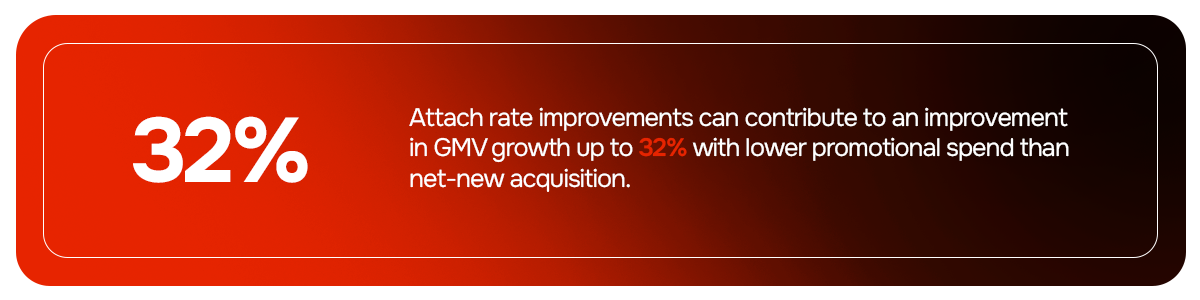
Attach rates in direct selling provide dual benefits, one to the company and the other to the distributor. Personal product use by distributors lets them speak more confidently about the products and share the results they experienced to their customers. Customer-distributor relationship improves, and distributors become capable of naturally recommending complementary products.
Why executives ignore attach rate as a metric
Attach rate is not associated with rank bonuses or exciting product launches. It is also not cited as an influential factor in business presentations. Because of these reasons leadership teams give more importance to immediate attention seekers such as product launches, rank advancement campaigns, and surprise incentives. This creates great impact but budgets are high and the growth may not be consistent. It might spike for a while and then level down.
When companies prioritize attach rate as a strategy with other mainstream metrics, it automatically improves distributor behavior and customer experience. This happens in three ways:
- Distributors will be trained to recommend complementary products.
- Advanced cross-selling and upselling technology personalizes recommendations for each customer during the ordering process.
- The compensation structure is optimized to encourage multi-product sales.
Increasing attach rates with AI-powered tools
Product recommendations have made a major impact in increasing the revenue of businesses and in this AI plays a crucial role. In the past two years, AI tools have become an affordable asset for SMBs. These AI tools analyze customer purchase history to recommend products just at the right time in their purchase journey.
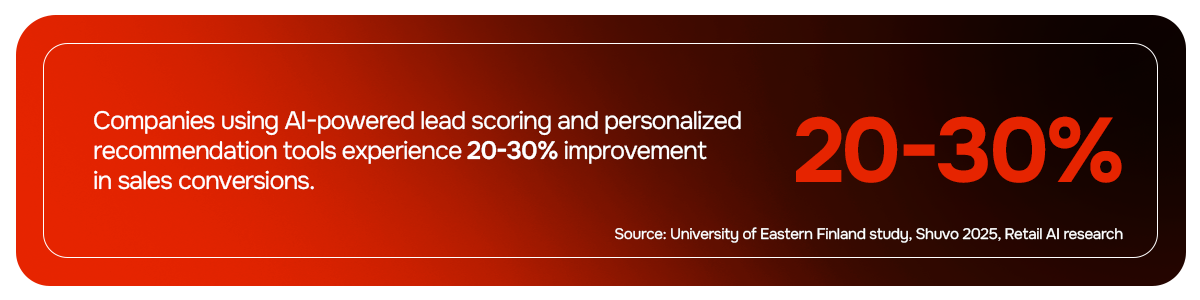
Distributors with good product knowledge and marketing skills can make the same recommendations as any AI tool. But AI tools can do this for every order, every customer, every transaction without depending on a distributor’s knowledge or that day’s motivation levels.
Order design influences attach rates
Small design changes with an understanding of customer behavior in the ordering process can increase the number of products in an order. Customers feel comfortable to continue with their default option with an add-on already added to the product than selecting it manually. Also, setting the price of the core product at full value and recommending an add-on at a complementary price increases the chances of purchase. If companies do not wish to reduce product prices for the long term they can opt for a time-limited discount or incentive on attach items. Applying behavioral data on customer psychology can increase attach rates and brand margin.
Strategic decision #2: List attach rate as a priority growth metric
Direct selling leadership teams can evaluate the importance of considering attach rate as a priority metric by asking these questions:
- What is our average attach rate per order?
- Does attach rate improve when distributors are experienced?
- What is the difference in attach rate between our top performers and average performing distributors?
- Does our technology support personalized product recommendations at checkout?
Attach rate should be made a core KPI, no doubt. But leaders must also evaluate their ordering process and customer experience to detect areas where they can apply small design changes to improve attach rates. Along with this, any technology requirement to optimize attach rates must also be studied and implemented.
Average Order Value
Most direct selling companies track AOV as a revenue-generating metric. When there is an increase in AOV, the leadership thinks that the pricing is strong and when it depletes, they consider increasing the price. This pricing perspective is wrong or incomplete.
The factor that complements and boosts AOV is actually product innovation. Customers pay more when they think that they are getting more value. So, to increase AOV brands must launch premium products that provide added value to customers. Increasing the price can boost AOV but not for long. This also affects customer satisfaction scores and increases in refunds in the following quarters.
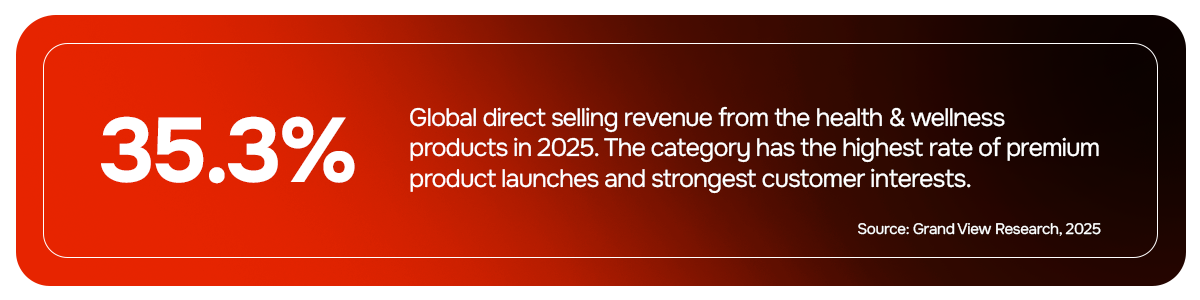
Direct selling companies in health and wellness and beauty and cosmetics industries have higher chances of launching premium products because customers care deeply about ingredients, effectiveness, quality of sourcing, and brand story.
Product strategy affects AOV
In the direct selling industry, many companies focus on their core products with time and resources invested in their promotion. It is true that these products build brand identity and repeat purchases but clouds product innovation. When a company depends on a few flagship products and stops launching new ones, their portfolio remains static. They lose competitive advantages of growth and expansion.
Companies in industries like beauty and wellness are moving away from big product launches toward smaller and more frequent product launches or limited edition products. These companies experience higher AOV because new products give customers a range of options to add to their cart. Constant innovations from a brand retain its relevance and credibility. New products also give distributors fresh stories to engage customers.
Many companies also fear that launching new products will reduce the sales of their core products. But there is no evidence to prove this. Moreover, when new products are complementary along with core products, they increase sales.
The problem with over-relying promotions
When promotions increase, customers get used to buying only during offers and the full-price purchase declines. Each promotion only brings a slight improvement in sales but underneath, it affects margin and pricing.
The company becomes trapped in a cycle: a promotion runs, sales rise temporarily, then slow down again. Another promotion is launched, sales spike, then slow once more, and customers begin waiting for the next promotion.
Companies must track promotional GMV against the total GMV with a promo engine. If the percentage is somewhere even close to 25-30%, it means that your brand is over dependent on promotions. This puts the brand in a dangerous situation because when a major part of the revenue comes from promotions, profits reduce and customer behavior changes in a way that weakens the company’s long-term profits.
| AOV Health Signal | Alert Threshold | Strategic Response |
|---|---|---|
| Revenue from products launched in the last 18 months | Below 20–25% of total revenue | Increase product development frequency |
| % of promotional GMV as a % of total GMV | Above 28–30% | Monitor discount dependency and build premium product launch strategy |
| NPS in premium SKUs vs core SKUs | Premium NPS more than 5 points below core | Review premium product value communication and sampling strategy |
| Year-on-year AOV growth rate | Below inflation rate | This is a structural AOV issue. Verify pricing and the need for product innovation |
Strategic decision #3: Transform product innovation from a marketing strategy to a structured revenue strategy
Companies must keep a check on their promotional process and the subsequent revenue generated after each promotion. Launching new products should never be for marketing, it should be a structured process that would enhance brand identity and customer interests.
Exactly for the same reason, product innovation should be tracked as a KPI by measuring the revenue generated from products launched within the last 18 months. A 20-25% of total revenue from newly launched products shows that innovation is yielding good results. Even when new products are launched, resort to smaller, more frequent launches with a limit set on promotions.
This boosts AOV and brings engagement and excitement among your distributor networks.
Payout ratio and compensation design
Compensation plans are the core of all MLM operations. Distributors choose a company based on its compensation structure, and profits, compliance, and field trust all depend on it. But once it is drafted, many companies ignore its importance to be reviewed and updated. Plans designed years ago may not work well in the current market and growth conditions.
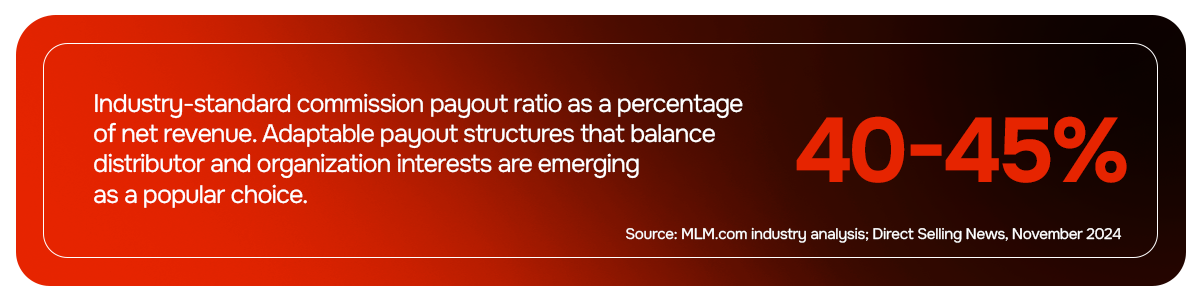
The standard payout percentage, for years, has been 40-45% of the company’s total revenue. This has been a set standard for decades now and balances attractiveness to distributors with corporate sustainability. But in 2026, the market conditions are different. Direct selling companies with low product margins, high supply chain costs, and a binary MLM plan with weekly payouts may find 45% commission payout negatively impacting their EBITDA. Also, companies with premium products and high margin expectations sticking to 40% can damage field motivation and as a result company profitability.
Structural risks with binary plan
Binary MLM plan is popular in the multi-level marketing industry for its simple structure. This makes it easier to explain to distributors and the leg balancing brings the benefit of team building for the company. But there are a few structural issues that can create serious consequences in today’s situation.
Binary plans may cause commission leakages when commissions are not paid for actual customer sales or sales volume accumulates on one leg. It turns costly for the company when it rewards activity instead of performance.
Compensation experts and research conducted by DSA partner organizations reveal that companies are moving away from dominant binary structures toward a more sustainable retail-sales-based model. This way, payouts align with revenue and compliance.
Trend toward simplified performance-based plans
Compensation plans in direct selling are changing because of the change in distributor expectations. A study conducted in November 2024 by DSN and its partners found that new and young distributors are less interested in building large teams or climbing a difficult rank ladder. They are interested in a simple and transparent way to earn supplemental income through product sales.
The shift offers a challenge and opportunity for direct selling companies. The challenge is that most compensation plan designs are beneficial for distributors who want to build a large distributor network and for those who want to simply sell products and earn commissions this might not work. The opportunity is that simplifying earning structures for distributors is set to see an increase in engagement levels and decrease in admin and financial complexities.
A compensation plan that rewards the top 0.05% with higher income and offers the other 99.95% with opaque and difficult-to-achieve earnings criteria will bring with it financial and compliance risks along with breaking distributor trust.
Payout timing determines distributor retention rates
Payout timing and frequency are major influential factors in distributor retention. According to a 2025 survey by PayQuicker cites that delayed payouts can cause distributor churn and reduce the annual sales of the company by 15% due to attrition. Today’s gig economy considers faster effort recognition as a factor to stay with the business.
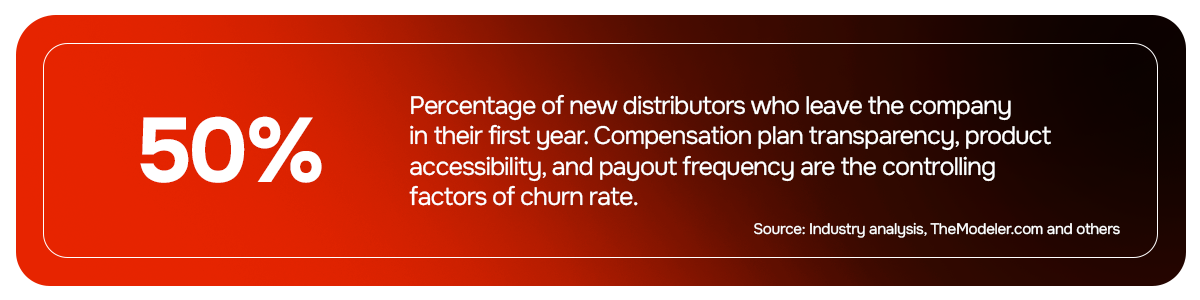
This is not a concluding statement asking companies to accelerate their payout processes immediately. That again brings compliance and cash flow issues. The point is to establish a transparent and frictionless payout process for distributors.
Stabilizing payouts with governance innovation
Payouts properly planned and managed can improve profit margins. Direct selling industry in the past decade has seen major developments in compensation plan management. Commission management software automated rules design payout rates automatically based on real-time data affecting margins such as increase in supply chain costs, FX rates, etc.
In the absence of guardrails, companies tend to pay commission percentages that are not sustainable and this badly affects margins. When adjustments happen automatically, there is no need for hasty decisions or distributor confusion. Companies that use guardrails have more stable payout ratios and better financial predictability.
Automated commission management technology is implemented in every standard MLM platform. The ROI for investing in such technologies is stable payout ratios that protect EBITDA and predictability that brings distributor trust.
Strategic decision #4: Make payout design a strategic priority
The compensation plan must be regularly reviewed against current distributor behavior, margin structure, and regulatory conditions. The payout percentage should be within safe limits and fluctuating percentage even within an eight-quarter range creates financial unpredictability and risks. Another payout point to ponder is that whether it is sales-focused or good for only the top 1% of earners.
Three payout commitments can set aside the risks.
- Make compensation a board-level priority with payout percentages, plan structure, and profit protection limits.
- Keep a check on distributor retention data. If first year distributor attrition rate goes above 50%, then you must ensure what caused it. Compensation plan, product issues, or market fit?
- Evaluate the capabilities of your current technological infrastructure, including auto-adapting of payout ratios.
Discover how we build resilient businesses with advanced MLM functionalities



Impact of the four KPIs together
Each KPI makes a clear impact but in different operational domains. However, the combined effect of this will multiply quarter after quarter. Customer acquisition through persona-based targeting and referrals will improve the number of active members in the network. Higher attach rates improve customer lifetime value and product innovation will increase profit margins. Together with this, when the payout design is strengthened, it protects EBITDA and investment capacity.
The table below provides targets with directions to implement these KPIs in 2026.
| KPI | Current benchmark (2025) | Strategic target (2026) | Primary lever |
|---|---|---|---|
| CAC payback Period | 5–6 months (est. industry median) | ≤ 4 months | Referral-first acquisition + persona precision |
| Attach rate (items per order) | 1.8–2.1 items | ≥ 2.3 items | AI recommendations + choice architecture redesign |
| % revenue from <18-month SKUs | 15–20% (typical) | ≥ 25% | Quarterly innovation cadence + limited editions |
| Payout ratio (% of net revenue) | 40–46% (wide variance) | ~44% with ±1.5pp variance | Gross-margin guardrails + plan simplification |
When the four KPIs start to operate together, growth, retention, and profitability go from strength to strength.














Leave your comment
Fill up and remark your valuable comment.