


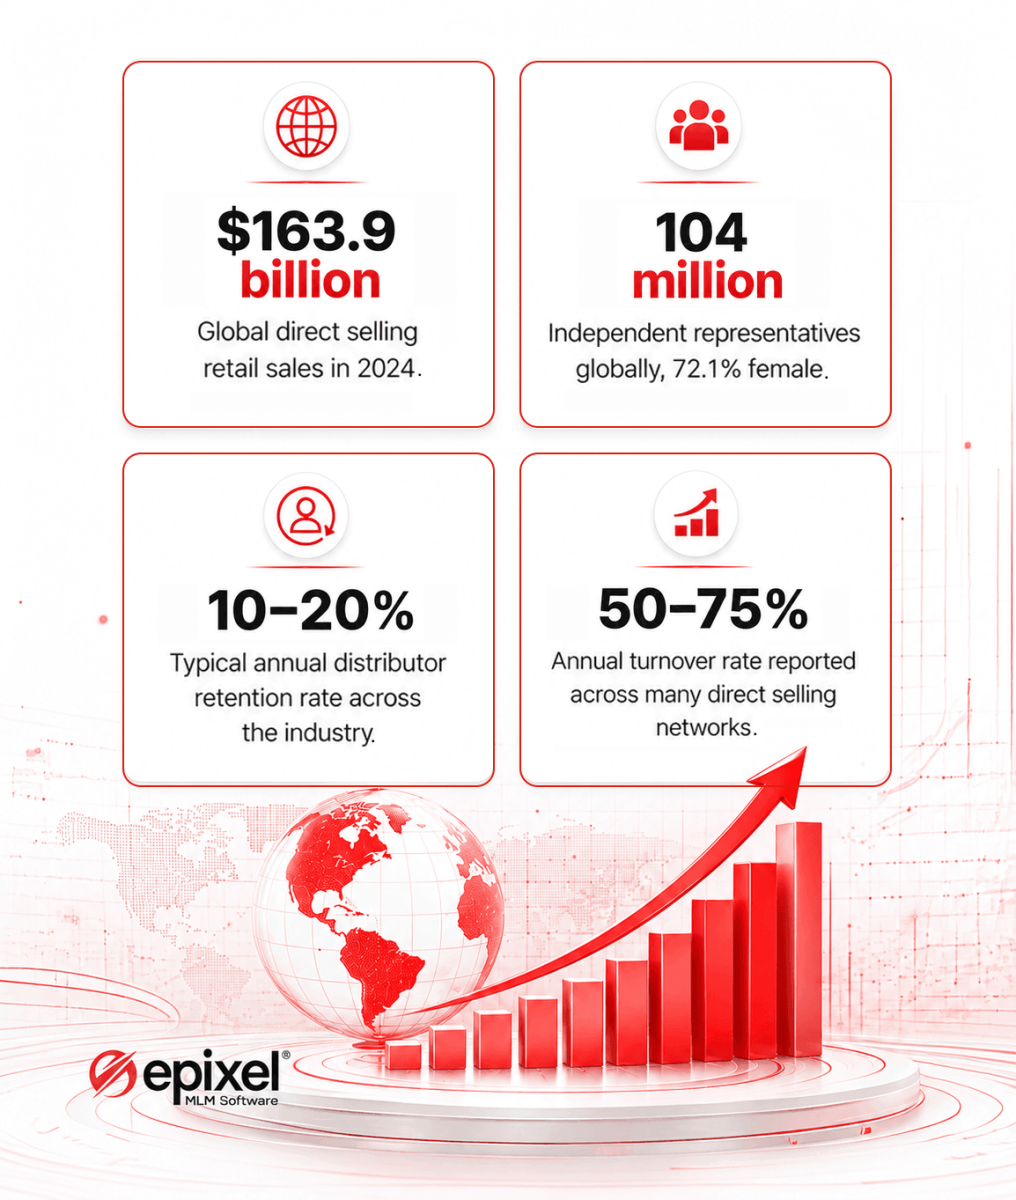
Distributor behavior in the direct selling industry is shaped by incentive design. But companies focus on the total cost of incentives they should pay instead of the behaviors those incentive structures would build. It is on this behavioral architecture that the entire direct selling industry is built. The global direct selling industry which generated $163.9 billion in retail sales across 55 markets, with 104.3 million independent representatives worldwide, still has few underlying issues that go unnoticed. The direct seller number in the WFDSA report also represents inactive distributors who do not generate consistent sales along with disengaged sellers and those who quit the network after a few months of joining.
Distributor retention rates in the industry fall between 10 and 20%. Companies struggle to maintain their network size and often this leads to recruiting pressure within the network. It impacts profits, leadership, and overall growth.
There are companies in the industry that offer the same commission percentages, but profits and retention rates vary. This is due to the difference in the incentive design. Paying more or paying less do not make much of a difference but the structure does. Because it is through a right incentive structure that profitable and sustainable behaviors are created.
This study explores those incentive structures with data to understand distributor behavior, incentive waste, incentive power, and the future of personalized incentive design.
Core thesis
Incentives as a behavioral architecture
An important insight to note in the industry’s incentive data is that you are not paying for an activity that would have happened anyway. You are purchasing a behavioral future that would not exist without the incentive’s architecture. This difference carries a strategic weight.
For instance, if a Fast Start bonus made a distributor to recruit aggressively in their first 60 days, that behavior is the result of the incentive command. Remove the Fast Start bonus and the recruitment rate will fall drastically. In the same team, if you implement a leadership bonus, the same distributor will focus on training and supporting his team members, not on new recruitments.
Monetary rewards influence behavior only for a limited time unless they are delivered quickly or align with distributor’s goals. The effectiveness of an incentive depends on its design not how much monetary value it holds. A mistake few direct selling companies make is to design an incentive focusing on one behavior like recruiting or selling. But for long-term success distributors must sell, recruit, stay active, and develop leadership skills at the same time.
One incentive structure cannot drive all of these behaviors effectively at once. Hence, direct selling companies must build multiple effective incentive structures that encourage different actions at different stages of a distributor’s direct selling career.
Finding #1
Incentive type vs. distributor activity
When distributor activities like login, sales events, recruiting, training completions, and customer orders, a pattern that emerges shows that the type of incentive predicts the type of behavior it creates than the size of the incentive.
The data in the following table is drawn from patterns observed across direct selling networks operating across North America, South and Southeast Asia, and the Middle East. It shows the behavior instilled by each type of incentive. The activity measurements are expressed in comparison to the average engagement level before the incentive was introduced and is set at 100. Values above 100 shows increased activity and below 100 shows reduced activity.
Table 1 — Incentive type vs. primary behavioral response
| Incentive type | Login activity | Sales activity | Recruiting activity | Training completion | Primary behavior |
|---|---|---|---|---|---|
| Fast Start Bonus | +48% | +36% | +74% | +22% | Recruiting |
| Binary / Team Volume Bonus | +31% | +29% | +55% | +18% | Recruiting + Sales |
| Matching Bonus | +29% | +18% | +21% | +48% | Leadership / Mentoring |
| Leadership Pool Bonus | +26% | +22% | +19% | +61% | Leadership / Team building |
| Rank Advancement Bonus | +54% | +44% | +38% | +52% | Broad activation |
| Lifestyle / Luxury Bonus | +39% | +41% | +33% | +35% | Aspirational selling |
| Customer Volume Bonus | +22% | +68% | +8% | +14% | Genuine sales |
Index values show changes in distributor behavior compared to activity levels before the incentive was introduced. Actual results may vary based on the network, market, and distributor group. Based on aggregated data analyzed by the Epixel MLM Software Data Team.
Key Finding
Fast Start bonuses are reliable enough to produce a 74% increase in recruiting activity but in terms of training completion it helps only about 22%. Leadership Pool Bonus inverts this result. So, if your goal is to build a qualified leadership layer then Fast Start-based incentive structure will not complement it.
One pattern draws attention from a compliance and sustainability perspective. The Customer Volume Bonus which rewards real sales to customers shows the lowest recruitment increase (+8%) and the highest real sales activity (+68%). Companies whose incentive design focuses on Customer Volume Bonus build strong regulatory profiles and experience lower churn rates.
Finding #2
Activity spike analysis
The analysis on activity levels gives a new dimension to the influence of incentive structure in creating new distributor behaviors. Common compensation plan reviews only look at what an incentive pays and to whom. The behavioral activity it generates is overlooked. Our data tracks three time periods: seven days before an incentive activation, the period during which the incentive is active, and 30 days after the incentive expires.
Table 2 — Activity decay analysis: 30 days post-incentive vs. incentive period peak
| Incentive type | Pre-incentive period | Active incentive period (Peak) | 30 days after incentive conclusion | Behavioral durability |
|---|---|---|---|---|
| Fast Start Bonus | Baseline | +68% | –28% below baseline | Low — Creates spike and crash |
| Matching Bonus | Baseline | +31% | +18% above baseline | High — Habit formation |
| Rank Advancement Bonus | Baseline | +52% | +9% above baseline | Moderate — Milestone anchor |
| Pool/Leadership Bonus | Baseline | +26% | +22% above baseline | High — Identity reinforcement |
| Lifestyle/Trip Incentive | Baseline | +61% | –12% below baseline | Medium — Post-event fatigue |
| Recognition/Leaderboard | Baseline | +44% | +24% above baseline | High — Social identity effect |
Values presented here represent estimated durations of incentive-driven behaviors. Results may differ based on the incentive structure, communication approach, and distributor segment. Data source: Epixel MLM Software Data Team.
The pattern around Fast Start bonus teaches an important lesson. Distributors are at their peak performance levels during the incentive period but after that the performance declines, way below than it was before incentive activation. In behavioral economics, this is called crowding-out effect. When an external reward creates a behavior which a distributor independently did not choose, the effect will be short lived. An MLM network highly dependent on a Fast Start bonus can make the distributors think that selling and recruiting are worth pursuing only when an incentive is attached to it.
Key Finding
Recognition programs and matching bonuses create strong distributor behavior even after active incentive period. They are also not the expensive incentives on the list. Recognition programs create a sense of identity and belonging and matching bonuses encourage leaders to help their teams succeed. These sustainable ways of network growth make recognition programs and matching bonuses a strong incentive pair.
Finding #3
Incentive elasticity
MLM companies sometimes leave out calculating incentive elasticity which measures how distributor behavior changes when the incentive value changes. Direct selling leaders must understand that huge incentive values will not generate exceptional outcomes. They must understand at what point does the larger bonus stop generating proportionally more activity.
Our analysis across various incentive structures revealed that the relationship between bonus size and behavioral output will reach a saturation point. During the early days of an incentive increase, behavioral activity reaches its peak and then levels off. This increases payout costs.
Table 3 — Incentive elasticity: Bonus size vs. activity increase (Hypothetical saturation model)
| Bonus increase vs. baseline | Activity — Fast Start | Activity — Rank bonus | Activity — Recognition |
|---|---|---|---|
| +10% | +22% | +18% | N/A (non-monetary) |
| +20% | +38% | +29% | N/A |
| +50% | +49% | +41% | N/A |
| +100% | +52% | +46% | N/A |
| 2× recognition visibility | N/A | N/A | +54% |
Key Finding
Companies who properly audit their incentive ROI find 20-35% of their total compensation costs produce near-zero marginal behavioral returns. This is an incentive waste that impacts company and salesforce growth.
Recruitment quality vs. volume
New recruits join a network through different ways. It can be through referrals, independent decisions, or through promotions or incentive programs. If the recruit was brought in through incentive programs, it can predict with accuracy for how long the distributor will stay and how active they will be.
Recruiting incentives for network volume expansion encourage distributors to recruit large number of sellers into the network but those recruits will become inactive quickly or generate low sales or even quit before 90 days. Selective recruiting incentives present distributors with an option to plan their sales activity and recruit people who are really interested in the opportunity. Such a passionate group of recruits, even though less in number, stays active for the long term.
Table 4 — Recruit quality by incentive type
| Incentive context | Recruits/Distributor monthly | Active after 90 days | First sale in 30 days | Active at 12 months |
|---|---|---|---|---|
| Fast Start bonus period | 3.2 | 34% | 28% | 12% |
| No active incentive | 1.1 | 41% | 35% | 18% |
| Leadership mentoring program | 0.8 | 58% | 49% | 31% |
| Matching bonus active | 1.4 | 52% | 44% | 26% |
Here the pattern is crystal clear. Incentives like Fast Start bonus generate 3x enrollments than a leadership mentoring program, but the 12-month retention rate is less than half. This implies that companies that are concentrating on recruitment are building weaker networks which increase churn rates and disengagement of supporting distributors.
Companies that route their network’s focus on leadership development will have stronger networks and higher distributor satisfaction scores. The attrition rates in the first year will also be lower. When networks are built with high quality distributors, the recruitment rate will be lower but it adds to the strength of the network.
Key Finding
For stronger networks, MLM companies must focus on recruiting quality distributors which might temporarily result in a decline in enrollment volume but would be beneficial for business growth in the long-term.
Finding #4
Product sales behavior
When incentives are designed to boost product sales, it can cause sales increase but can also invite regulatory scrutiny with inventory loading by distributors for bonus qualification. The behavioral data along this aspect shows compliance and strategy teams the difference between sales growth through real customers and personal purchases by distributors that invite regulatory risks.
Table 5 — Sales behavior signals by incentive context
| Sales behavior signal | Healthy demand indicator | Inventory loading indicator |
|---|---|---|
| Repeat purchase rate (30 days) | 38–55% of buyers reorder | Under 15% reorder rate |
| Order timing distribution | Spread across the commission period | Heavily clustered in final 5 days of period |
| Average order value during incentive | +10–20% increase | +60–120% spike |
| Return rate after incentive period | Under 5% | 8–20% return rate in following period |
| Product mix during incentive | Consistent with non-incentive periods | Higher in top selling products |
Key Finding
Incentives that reward customer subscriptions and repeat purchases create high reorder rates and fewer returns along with consistent sales growth. Single volume spikes do not create sustainable growth, for that sales have to be consistent over a prolonged period of time.
Finding #5
Retention impact analysis
One surprising finding in our study is the existence of a category, what we term as activity-retention decoupling. It means that the incentives that considerably increase distributor activity simultaneously reduce long-term retention probability. This insight is crucial for executives who consider activity metrics as an indicator of network health.
Table 6 — Retention rate by incentive exposure type
| Incentive type | 30-day retention | 90-day retention | 180-day retention | Pattern |
|---|---|---|---|---|
| Fast Start bonus only | 72% | 41% | 22% | Sharp decline |
| Rank advancement + recognition | 78% | 58% | 44% | Consistent engagement |
| Matching bonus active | 74% | 55% | 41% | Moderate durability |
| No structured incentive | 61% | 38% | 19% | Baseline |
| Autoship/Subscription incentive | 81% | 64% | 51% | Highest durability |
| Leaderboard/Social recognition only | 76% | 60% | 46% | Strong — Social Identity |
The top incentive type here is autoship and subscription incentive. When a distributor is enrolled in an autoship and subscription incentive structure, their income and motivation become consistent, and they stay active for long.
Finding #6
The psychology of first earnings
The time and size of a distributor’s earning determine their long-term engagement with the brand than any other bonus they would receive later. When we analyze the compensation structure of MLM companies in the industry, we see that most plan designs are built on the leadership pools, the matching bonus levels, the lifestyle cars and travel incentives, which only attract and motivate top performers.
The behavioral analysis of various network structures shows that a distributor becomes an active and engaged network participant or a 90-day dropout depending on their first earnings event.
Earning their first commission is the proof that they have earned the identity of a direct seller, a brand representative. It is more emotional than monetary. It instills confidence in each seller and serves as a catalyst to more logins, more recruits, and more sales. It is something even a large bonus can’t replicate.
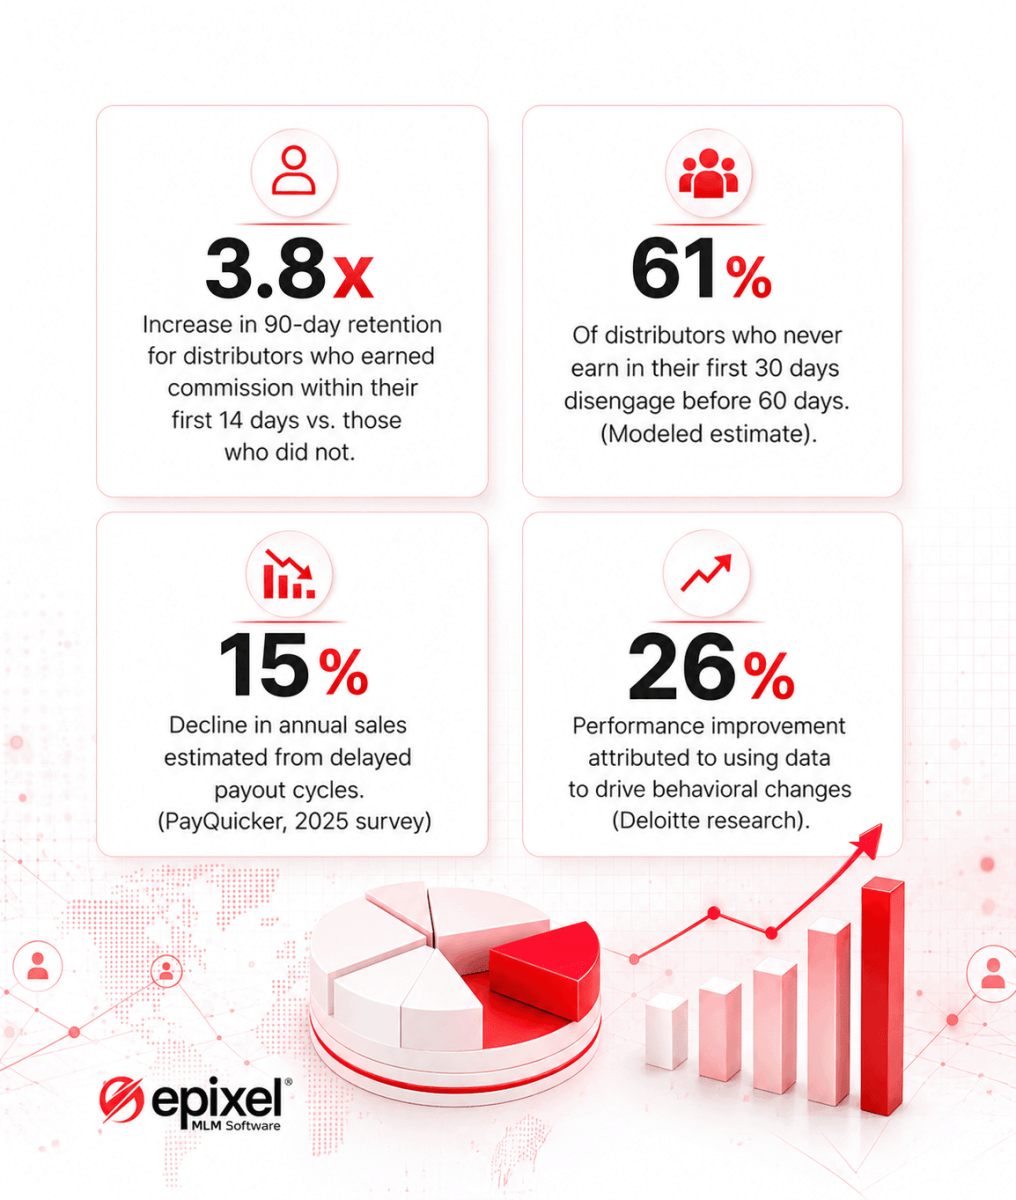
Companies should design their compensation in such a way that new distributors earn their first earnings within 14 days of joining. The amount need not be large but should be noticeable enough for the distributor to feel rewarded and motivated. Enhancing this early earning experience is more important than increasing bonuses for top leaders later.
Key Finding
Distributor retention is not dependent on the size of future rewards. It is more dependent on how quickly a new distributor achieves their first successful earnings.
Finding #7
Behavioral economics of non-monetary incentives
Our research on recognition vs. monetary incentives favored the former with latter only creating short-term impact. Recognition outperforms cash rewards in building long-term engagement, team collaboration, and distributor identity.
Distributors need something that is socially visible that they can incorporate as an entrepreneur. This is backed by research published in Choi and Presslee, 2023. The research found that non-monetary rewards that are socially visible enhance engagement more than equivalent cash bonuses.
- 65% of workers across multiple industries prefer non-cash incentives when given a choice.
- 92% of employees are likely to repeat a specific behavior after receiving visible recognition for it.
- Organizations with strong recognition programs report 27% higher profit margins and a 50% higher sales rate.
- Leaderboard and recognition programs in direct selling keep distributors engaged at levels comparable to cash bonuses and are more cost-effective to offer.
Powerful recognition methods should be a mandatory part of an MLM compensation plan. It should be strategically designed to elevate engagement levels. Successful direct selling companies often implement both, cash incentives for short-term activity improvements and recognition programs for higher engagement and retention rates.
Key Finding
MLM companies must try and balance monetary rewards and recognition in each distributor tier to ensure optimum retention and engagement levels.
Finding #8
Distributor segment analysis
A central design error in most MLM compensation plans is structuring it under the notion that all distributors respond to the same incentive structures. When analyzing the behavioral data, the story is different. Each distributor segment has a specific incentive structure they respond to. That is to say, an incentive that encourages sales in new entrants may not work well in the top tiers.
Table 7 — Incentive effectiveness by distributor segment
| Segment | Characteristics | Primary incentive driver | Key risk |
|---|---|---|---|
| Inactive (~35–45%) | No meaningful activity seen in 60+ days. They could have joined only for product discounts. | Reactivation campaign + early earning trigger | Cash incentives alone is ineffective and needs personalized re-engagement. |
| Casual/Occasional (~25–30%) | Inconsistent orders and social sharing. Not building seriously. | Low-friction product bonuses + recognition programs | Distributors can easily disengage when overloaded with complex rank-building targets. |
| Active seller (~15–20%) | Consistent sales to customers. May or may not be actively recruiting. | Customer volume bonuses + retail profit incentives | Pyramid-based compensation plans undermine this segment's contributions. |
| Key Recruiter / Builder (~8–12%) | Focuses on enrollment than sales. Keen on expanding team volume. | Fast Start, Binary/team bonus, Rank incentives | Can produce low-quality networks if recruiting is rewarded over activation or sales. |
| Leader / Mentor (~3–5%) | Builds and trains team. Long-term retention. Contributes high value to network stability. | Matching bonus, Leadership pool, and public recognition | This segment churns when companies redesign compensation plans without consultation. |
Key Finding
Majority of MLM networks are sustained by 3-5% of distributors who are responsible for 40-60% of total active distributor management and network stability. Incentive architectures that fail to protect these segments have weaker networks with high rates of churn.
Finding #9
Incentive complexity and churn
Understanding the incentive structure is important for distributors to know how they earn what they earn. If in a network, a distributor cannot explain how they earn will have lower engagement levels, higher support tickets and disputes, and churn rates. Compensation plan designers may not understand the underlying complexity in the plans, but a distributor trying to understand the business will.
Research in various behavioral economics has proven that when individuals cannot predict the relationship between their effort and their reward, motivation declines. Sometimes, the plan can be generous and technically brilliant but if it fails distributor understanding, then it cannot cultivate the behaviors it was meant to.
Table 8 — Plan complexity vs. behavioral outcomes
| Complexity level | Incentive participation rate | Support ticket volume | Commission disputes | 12-month active rate |
|---|---|---|---|---|
| Simple (1–3 earning mechanisms) | 74% | Baseline | Low | Higher |
| Moderate (4–6 mechanisms) | 58% | +35% above baseline | Moderate | Moderate |
| Complex (7+ mechanisms) | 41% | +80% above baseline | High | Lower |
The participation rate is 41% in complex incentive architecture. This means that the remaining 59% do not understand the plan or are not interested in pursuing it. The company still spends money to maintain that incentive, but distributors are not engaging with it nor is it influencing the behavior.
Key Finding
A simple compensation architecture is always a behavioral asset. The best incentive structure is the one that most distributors can easily understand and confidently apply in their direct selling career.
Discover how we build resilient businesses with advanced MLM functionalities


Finding #10
Churn risk and the repeated miss effect
Distributors come very close to achieving an incentive target but fail to qualify, this is what we term miss effect. This behavioral pattern causes the churn risk to rise in the following 30-60 days and is caused by a structural defect. When qualification criteria are set at levels which a majority of active distributors can nearly reach but not complete, it does not motivate distributors. It creates a helplessness that slowly turns to churn.
- Distributors who qualify for at least one incentive in their first 90 days show higher retention rates.
- In distributor groups who qualify but miss incentive qualifications for two or more consecutive periods, the churn rate increases by an estimated 30-40% above average.
- Companies that personalize incentive structure according to each distributor segment’s behavior report lower attrition rates in the 90-180 day period.
Key Finding
An MLM network has distributors with different skillsets and experience. A single incentive target for everyone, top tier leaders might find it easy, but new entrants might find it unachievable. Personalized or tiered incentive goals make distributors feel near-misses are achievable and they keep trying which improves engagement and retention rates.
Finding #11
Incentive ROI
An incentive can be tagged impactful when it influences good behavioral returns more than the money invested. Companies can easily tell how much their compensation plan pays out but only few can tell you the behavioral returns each incentive brings. In order to track the ROI of an incentive, four measurable outcomes should be set: revenue generated, improvement in retention, recruitment, and productivity. Industry data shows that companies usually allocate 40-60% of revenue in compensation payouts and for sustainable plans the range falls between 42-46%.
Table 9 — Illustrative incentive ROI framework (Per $100K annual incentive spend, hypothetical model)
| Incentive | Annual cost | Est. revenue attributed | Retention lift | Recruitment lift | ROI signal |
|---|---|---|---|---|---|
| Fast Start bonus | $100K | $280–340K | Low (decays) | High (volume) | Volume, Low quality |
| Matching bonus | $100K | $240–310K | Moderate-High | Moderate (quality) | High LTV impact |
| Leadership pool | $100K | $310–420K | High | Low (selective) | Best network stability |
| Rank advancement bonus | $100K | $300–380K | Moderate | Moderate | Balanced |
| Recognition program | $20–30K | $140–220K | High | Moderate | Highest $ efficiency |
| Lifestyle / Trip Incentive | $100K | $260–320K | Low (post-event) | High (event-period) | Short-term, High cost |
* The financial figures presented are sample models intended to explain the ROI methodology. Actual results will vary based on network size, market conditions, and incentive design execution.
Recognition programs like leaderboards, awards, ranks, public recognition, badges, etc. are some of the best value incentive programs available for MLM companies. But many companies do not invest much in recognition programs because the results are not directly connected to revenue. Data from the industry say that this perception is incorrect because an ROI model must also consider retention as a value contributing factor to growth.
The future of distributor behavioral architecture
Incentive design in MLM will transform into a personalization-based model that adapt dynamically to different distributor behaviors. MLM software platforms already have the data to enable this but the challenge is building the analytical layer that would make it actionable.
Predictive incentive models trained on historical behavioral data can forecast how much a distributor can earn, how long they will be active, who will churn within 60 days, or who will change from a casual seller to an active one. These predictions will have high-value applications.
- Predictive models can predict distributors at the risk of churn and initiate re-engagement triggers that are personalized to their segment and recent activity.
- Personalized goal setting for each distributor segment creates the right mix of challenge and engagement to motivate distributors.
- Matching the incentive type to each stage of a distributor’s lifecycle increases behavioral returns.
- Offering high-value matching bonus and pool bonus for distributors who are interested in mentoring creates an organic way of leadership development.
Future MLM incentive systems will create unique and personalized behavioral architecture through adaptive incentive systems. Companies must monitor which type of incentive triggers what behavior in each distributor segment.
The strategic conclusion: The change data demands
This study aimed at challenging traditional compensation with behavioral evidence. We analyzed and understood the behavioral nuances in incentive design. Every compensation must be tested for this nuance, each compensation along with generating the intended activity must cultivate a beneficial behavior that fuels growth. First time earnings should be on priority to ensure long term engagement and reduce early dropouts.
Simple structures can improve distributor understanding and confidence along with reducing regulatory pressure for the company. Recognition should be built into the incentive structure with each incentive nurturing the intended behavior along with revenue outcomes.


Leave your comment
Fill up and remark your valuable comment.