


















 Epixel Analytics: Growth and Influence Insights
MLM companies can quickly point out their top performers who branch out their MLM tree in all directions. When the tree branches out wider and taller, it becomes difficult to trace the roots under whose influence it has eventually prospered. Likewise, tracing the leaders who brought real growth to the MLM tree becomes difficult to track as the network expands.
As far as your direct selling business is concerned, this is a missed growth opportunity. Distributor networks don’t grow in straight lines, they grow in clusters or scattered and from there they expand. When you know where the tree branches out fast or slow, you can predict where the growth is faster and where it is slower. This knowledge can tell you more than the growth path. It will help you create targeted strategies for markets and distributor segments covering overall aspects of inventory, product promotion, training, compliance, and support. The analysis also tells you if there are unhealthy recruitment practices in a certain region so that you can curb them before they grow into regulatory pressure.
The concept of “heatmaps of influence”
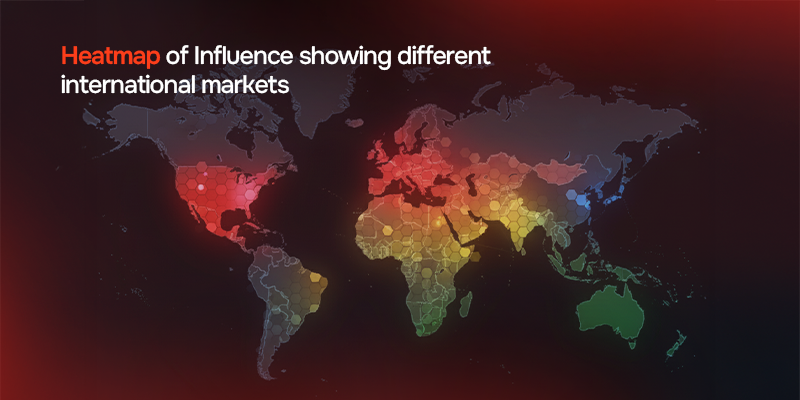
Heatmaps of influence show where in the network is sales and recruiting strong. The geographic map displays network activities in different color codes. Bright colored areas show where distributors are actively welcoming new members and light colored areas show low activity.
Heatmaps of influence will help you to understand business growth by region and track progress of applied strategies. It indicates risks and opportunities in various regional markets.
We understand the tremendous pressure direct selling companies face and hence we decided to set up this guide to help businesses create and use heatmaps of influence. These heatmaps of influence use advanced data techniques like H3 hex binning, gravity-style distance effects, and spatial spillovers. It shows the concentration of activities and their impact on neighborhood networks.
When the technical details are set apart, heatmaps’ real goal becomes that of an advisor who can help you make decisions through building a clear understanding on what patterns to look for on the map, how to respond, track improvement, and manage everything efficiently.
Wide geographical averages hide the real picture
Even the most modern analytical dashboards depict performance averages of large markets like a country or a state. This hides the reality of local markets and in MLM, growth is deeply local. People buy from those who they can trust, the ones in their close circles like neighbors, friends, and acquaintances, and hence recruiter’s influence is purely local.
In some closely knit neighborhoods, network grows faster because the first five houses a distributor converts lays the foundation for the next fifty. Also, a good distributor within five miles can convert more than a great distributor who lives across the town. In addition to these, there are other locally influential factors such as venues, delivery timelines, and small policy variations. Each of these determines how fast your network grows and how long it thrives in a particular region.
Where your network grows, even if that is a small dot on the map, matters. The location of distributor activity as shown on a heatmap is a prime signal that indicates your future growth even before your actual KPIs like enrollment or retention rates reveal it.
The data techniques behind
Heatmaps of influence are not technically heavy nor do they need a data scientist’s brain. They use simple data techniques to analyze business data and present it in formats that even people with limited analytics knowledge can easily understand.
H3 hex binning
This method is like laying a honeycomb over your MLM network map. The hexagons in the map are almost of the same size and represent a small area like a city or a street. Enrollment, referral, event, and order by a distributor is assigned to a hex. This helps you understand the true potential of smaller regions and compare areas fairly.
Gravity effects
Within the MLM network, the influence of a recruiter works like the gravitational pull. The areas and people closest to the recruiter join the network or purchase products easily and quickly compared to those who live in comparatively farther neighborhoods. As the distance increases, the “pull” decreases.
Spatial spillover
The success of one recruiter spills across a larger area, say, the neighboring town next to his neighborhood. When events or product sampling in one area influences the surrounding areas without any extra brand effort, this is referred to as spatial spillover.
Decision making tool for leaders and teams
Heatmaps of influence are interactive, meaning they don’t just show activity concentrations but help leaders and teams make prompt business decisions.
Core layers
In the influence heat layer, each area is represented as a hex and colored based on the activity in the past 30 to 90 days. The intensity of the shades is a combined effect created by new enrollments, first orders, and referral interactions. The color is depicted by giving more importance to a distributor’s direct efforts. All activities are not treated equally, due weightage is given to recruiter efforts.
Recruiter anchors pin the areas with the most number of active distributors. The size of the pins differs based on the distributor’s contributions, like the number of new members they have brought in or the sales that have happened around their travel radius.
Spillover arrows point at the directions in which the distributor’s influence is spreading, week by week. You can evaluate if growth is spreading to nearby areas or concentrating at the same place where the distributor is.
The compliance overlay represents areas with amber and red highlights where compliance checks are tested or returns, recurring income claims, or excessive chargebacks are high. Leaders can aptly spot compliance issues in time without running into complex regulatory troubles.
Operations overlay explains in a practical aspect the efficiency of your processes. It tracks orders to see if they are shipped and delivered on time, events are conducted properly, and venues are utilized to the maximum.
Controls
A time slider is designed for users to view activities in the past 12-16 weeks, and a hex resolution toggle lets users zoom areas to distinct neighborhood or metros to analyze distributor performance and operations in the area.
Users can also apply segment filters like products, ranks, acquisition channels, or markets to compare and review. A goal mode with “Growth”, “Stability”, or “Cleanup” settings can change areas of focus. Growth mode shows areas with high growth, stability mode shows where growth is consistent, and cleanup mode points toward areas with risks or compliance issues.
Map hovers
When a user hovers at any point on the map, a KPI summary pops up with influencer score on a scale of 0-100 within a 7/30/90-day period, number of new members, first orders, repeat purchases, and average time to first earning.
Other KPIs on hover are important compliance metrics like returns percentage, flagged income posts, and chargebacks per 1,000 orders. It also gives information about nearby recruiter anchors within a short distance.
The heatmaps of influence can’t be considered complete if it does not guide your distributors on where to go and what to focus.
Discover how we build resilient businesses with advanced MLM functionalities



Five patterns and plans of action
Shapes and color patterns in the heatmap are not pretty visualizations. It gives a complete picture of your network’s performance on the ground. When you start reading the underlying patterns in these colors and shapes, you will understand what to do next.
Strong center with weak surroundings
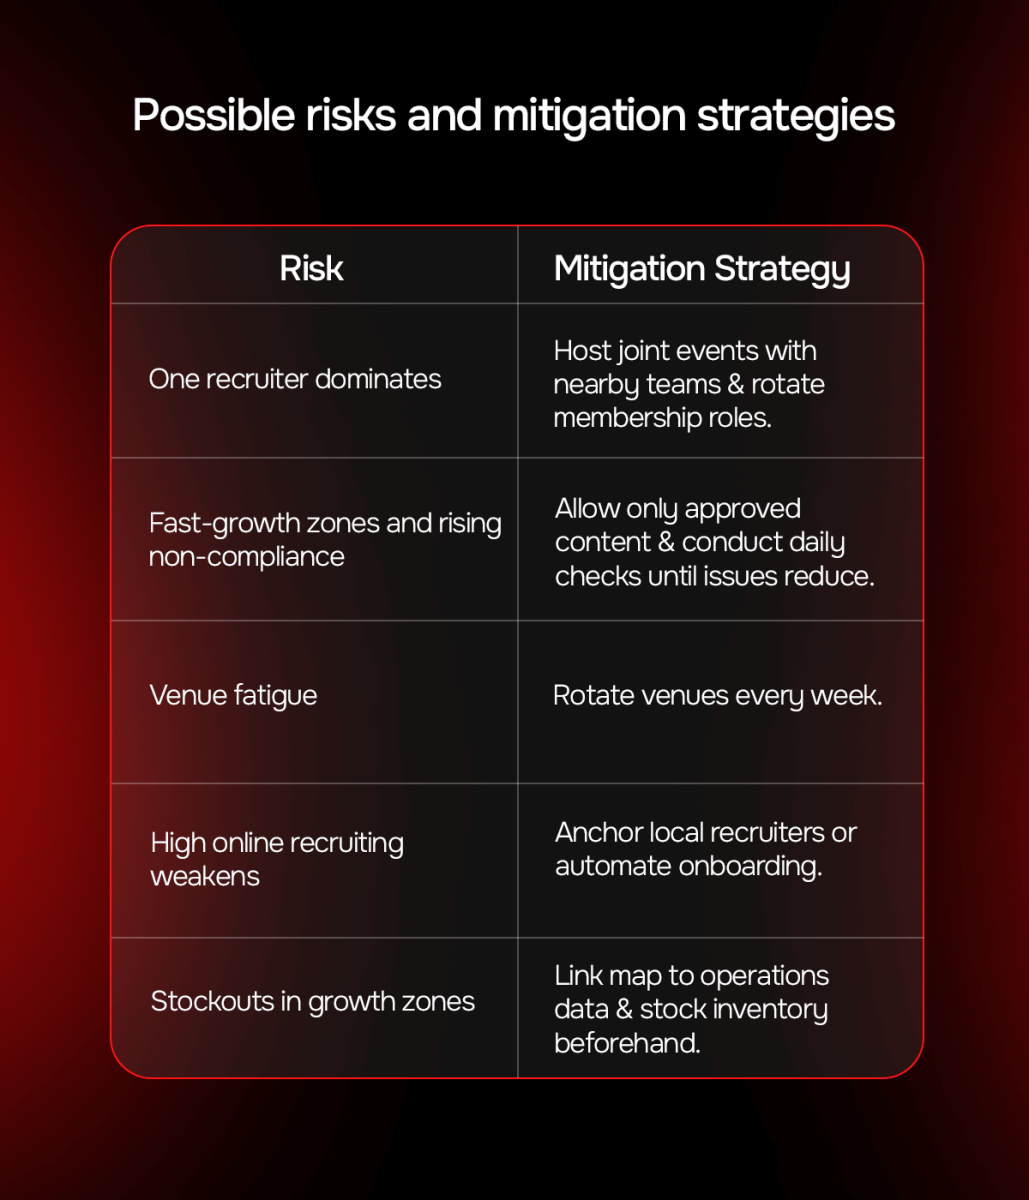
You might see bright red hexes with pale red hexes surrounding them. This means that you have active influential recruiters in the area, but their influence is limited to that area, not spreading. You will need to immediately work on this bright red area through an “Edge Activation” campaign which includes small coffee shop meetups, product demos, or workshops outside the active zone.
Encourage nearby associates to host them so that they feel responsible and accountable for the growth in the area. There are also chances of short-term improvements that fade later. Avoiding this is important. Keep the motivation level high with rewards for repeat purchases.
Know that your strategies succeeded if you see a 5-8% rise in conversions within a month from the outer area and the central area remains strong and stable.
Two separate, disconnected growth clusters
Two areas in a city show good growth levels but are not connected because their surrounding areas are cold. You have two strong distributor groups in the region, but their social connections ae not connected to each other. The reasons could possibly be the distance, travel-related issues, or absence of efficient prospecting strategies.
A “Bridge Market Plan” with shared events hosted collaboratively by the two teams. Keep the prospecting messages relevant so that both sides feel connected. The area between the two hotspots will start turning brighter and you will see more inter-team contacts forming. But, ensure compliance as there are chances of aggressive cross-recruiting.
Large warm plateau without hotspots
You might find areas that are performing evenly. No low performance or high, just even. Your network here is stable and not growing fast but distributors might be working harder. What is absent is a catalyst that can inspire engagement and urgency.
Setting up “Catalyst Plays” by teaming up with local gyms, cafés, or farmers’ markets can improve your brand influence locally. You can also try combining best-selling product starter kits with locally relevant products that suit the climate or market preferences.
If these turn out successful, you will see 2-3 new hotspots within 30 days and a warmup of the nearby areas.
Faster network growth with rising Amber areas
You will obviously feel happy to see lots of growth spots and increased activity in the areas but what is concerning is the expanding Amber areas which signify non-compliance. There could be increasing number of returns, false income or product claims, and other policy violations. This means that your training is failing, and it could turn risky for your brand if distributors continue to violate compliance policies.
Apply “Strict Compliance Moderation” in these areas with a team of responsible distributors or leaders as moderators. Allow only approved marketing content and cancel new bonuses for some time until the Amber levels go down.
The Amber areas should turn green in 2 weeks, and the number of complaints and support tickets should decrease. You might experience a slowing down of growth, but compliance is important, so focus on that.
Low local activity but high engagement online
The map shows low activity in the region but online metrics like orders and social traffic are increasing. This is because distributors are building networks remotely. This would look quite impressive in the beginning, but you will not have a rooted community locally which weakens the strength of the network over time.
You can either choose to anchor or automate, meaning you can anchor one representative locally who can set up events for you and keep the local customer tied to the brand. Else, you can automate the onboarding or host online community events because the networkers in the area are more digitally savvy. Autoship and subscription management strategies will work well in areas that are digitally bound.
If you succeed in satisfying your digital population then you will see the hexes indicating the area turn red with an increase in the number of repeat purchases and lower return rates.

Heatmap of influence in 90 days
Setting up a heatmap of influence for your brand is not a herculean task. The importance lies in your ability to decode the insights and implement the right strategies that strengthen the impact.
Days 0-30
Build the map as an interactive tool with the main layers such as Influence Heat, Recruiter Anchors, Compliance, and Operations. Analyze the growth trends for three months using a 12-week slider. As a first step to testing, choose two metro areas and launch one Edge Activation and one Bridge Play.
Fix base-level KPIs and strict compliance checks to clear flagged posts and customer concerns. Every weekend, study the map and identify emerging patterns to decide on one growth move and one protection move for the next phase.
Days 31-60
Testing, comparing the results, and learning from them will stand as a major focus during this period. If plateau regions pop up, implement Catalyst Plays to encourage activity in the area and review it with weekly comparisons. You can also recruit anchors who can influence growth in regions showing low activity during this period. Performance comparison of the indicated regions should be done every two weeks on first and second orders, return rates, and support tickets to see the impact.
Days 61-90
By this time, you will be able to see what works so that you can expand the experiment with proper management. The map can now be a part of your weekly sales activities and compliance discussions to help you make decisions based on relevant data and insights. Manage resources and funds by allocating them to areas where growth is fast and high. Add shipping performance and partner rosters as additional layers only if you think that it really matters in decision making. Each month should end with an analysis report published internally showing three successes, one shortfall, the lessons learned, and the next areas to focus.
Measure and plan your MLM network’s growth in every market with ready-to-use Heatmap of Influence
Strategic budgeting with heatmaps of influence
It is always wise to go by data than to go on assumptions and intuitions. Especially when it decides a “make or break” moment for your business, your decisions should be based on accurate data predictions.
If we are to look at a practical budget allocation model 50% should be allocated for Edge, Bridge, or Catalyst Plays in hexes that indicate higher returns. Any investment you make here will multiply your returns.
25% of your budget should go to areas with stable growth. Consider this as an investment for your retention efforts like local sampling events, ambassador stipends, or renewing community partnerships.
15% toward cleanup efforts is a necessity to ensure compliance. Allocation of this will go into training, copy moderation, and claims management so that petty issues do not build up.
The final 10% should be allocated to testing new experiments in cold but promising areas. These are your future growth zones, and focus should be given to enhance network activities in the area.
This, however, cannot be a final budget structure. The heatmap should be continuously analyzed and necessary amendments made based on improvements in each region.
Bringing your team into the heatmaps of influence
Your whole team working at different levels can make use of the heatmaps of influence for planning and achieving various performance goals. Regional Directors can focus on their particular metro and choose Growth Mode to identify five nearby areas that need impactful strategies for faster growth. Compliance Managers can spot Amber build-ups to understand areas with compliance concerns and implement strict moderation measures. Sales Operations Managers can use the map to download a list of event venues for the next month, forecast how many people would attend and how many starter kits to keep in stock.
Collaborate the implementation of Heatmap of Influence with your teams with a publish-ready brief
The growth of your MLM tree does not happen all at once. It grows slowly across different regions and in varying intensities. The heatmap of influence shows you how and where the growth is happening so that you can formulate strategies and route the growth in the right way. Every hex is a community of real people where conversations, events, and shared experiences happen. The map helps you to make these hexes shine brighter by guiding you to places where energy, trust, and compliance are rooted.














Leave your comment
Fill up and remark your valuable comment.