


















 Epixel Insights: Compensation and Payouts
Multi-level marketing companies design compensation plans as a backdrop to their brand story. Elements of distributor excitement and competitive advantage are crucial to the design, but it is often not stress-tested against real network behavior. When the company grows and starts expanding to new markets, this compensation structure slowly drains profitability from the inside.
When distributor churn increases because of the compensation impact, companies resort to aggressive recruiting. They design bonuses to increase distributor excitement during onboarding but that doesn’t help retention. Even the payout ratios are decided based on competitors and not by internal revenue efficiency. They measure success in recruitment volume but this is one metric that is least connected to long-term organizational health.
“The most profitable compensation plans in multi-level marketing are not the ones that are most generous. They are the ones that are behaviorally and economically optimized.”
Through this article, Epixel MLM Software’s Data Intelligence team has tried to create a framework based on behavioral and financial data of distributors from different markets and plan types. The team collected data from public disclosures, direct selling association reports, regulatory filings, and related platform observations. We are not trying to criticize any compensation model. Direct selling business with a perfectly built compensation structure shields itself from market shocks and risks. The article is created to help direct selling leadership with the analytical tools to design compensation plans that are generous enough to activate and retain distributors, and disciplined enough to ensure profitable growth across markets.
Strategic insight
Most MLM companies focus on recruitment when the actual need is payout sustainability. Profitability fades due to the gap between these two objectives.
The foundation of compensation plan profitability
Compensation plan driving growth or slowing it down depends on how sustainably companies are paying out their distributors. Well, the industry average sits between 40-45% of wholesale revenue but even at this range companies can see declining profits if their active-to-registered distributor ratio is poor. At a standard payout percentage of 40-45%, operations, product development, compliance, and network health are still smooth with sufficient margin. But a payout range below 30% fail to attract and retain quality distributors. Also, when companies go paying above 48-50% it results in initial excitement that turn into structural collapse because when the network expands the compensation plan fails to scale with it.
Take a look into the direct selling industry’s history and you can see companies that started with a generous compensation plan underwent a compulsory restructuring within 18-36 months.

The difference between total payout percentage and effective margin per active distributor is something companies need to monitor because even in the standard payout range, the company can lose profits if the balance between the two is not established. When there are large number of registered distributors who are not generating volume, the administrative costs are concentrated on a declining productive distributor numbers. This compresses the real profit margin of companies.
| CFO metrics to track for compensation health | |||
|---|---|---|---|
| Metric | Healthy range | Warning zone | Strategic priority |
| Commission expense ratio | 40–45% of wholesale | >48% sustained | Do a monthly review and initiate restructuring if the payout goes above 47%+. |
| Revenue retained after incentives | 55–60% | <50% | Set a minimum limit for operational stability. |
| Profit per active distributor | Tracked quarterly | Declining year-over-year | Primary health indicator. Segment by distributor rank. |
| Active-to-registered ratio | >35% | <20% | Shows plan design failure if payout percentage goes below 25%. |
Distributor activation in the first 90 days
Recruiting a distributor is far easier than activating them. When MLM companies focus on recruitment another important metric loses focus: What percentage of new recruits make their first sale and how quickly?
Distributor behavior patterns across global markets show that the activation window is narrow and the probability of a new distributor making their first commissionable sale drops sharply after their first 30 days. And, after 90 days this reduces to zero without any initial success. Often, this is not a problem related to motivation deficiency. It is the problem within the compensation structure and is fixable.
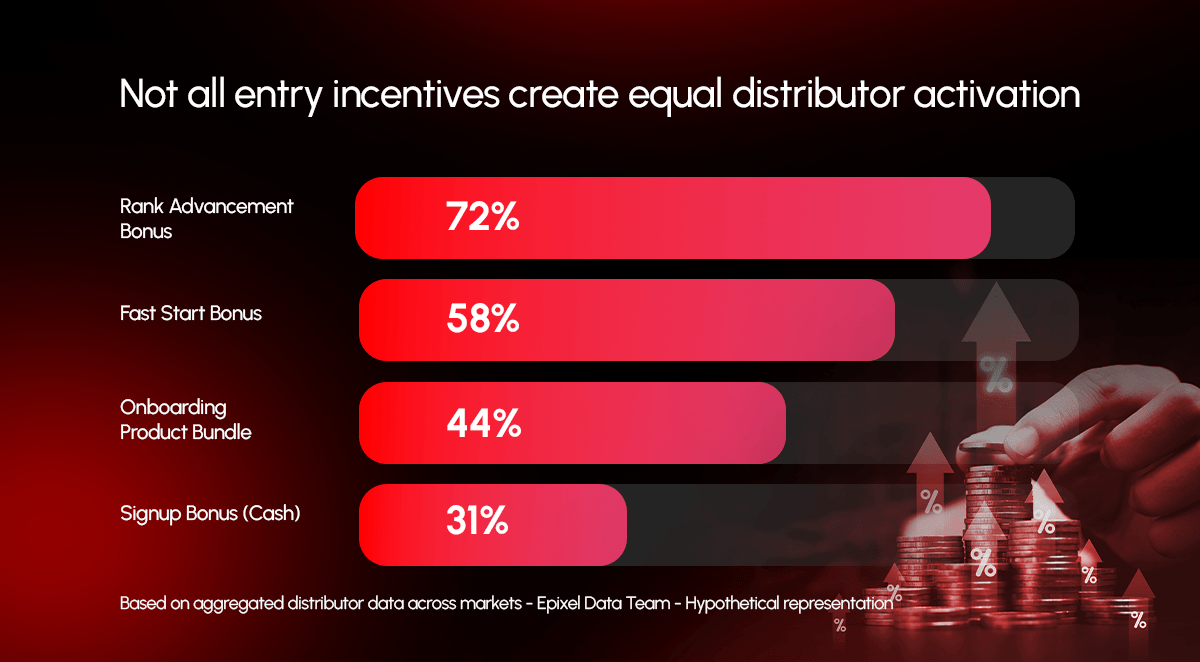
| Incentive type | Activation rate | Avg. time to first commission | Retention impact (90-day) | Long-term value |
|---|---|---|---|---|
| Signup Bonus (Cash) | ~31% | 38 days | Low | Low. Attracts bonus seekers. |
| Fast Start Bonus | ~58% | 22 days | Medium | Moderate. Depends on activity. |
| Rank Advancement Bonus | ~72% | 17 days | High | High. Contributes to behavior formation. |
When we analyze this data, it becomes evident that the bonuses that reward behaviors like selling, team building, and rank progress create higher retention rates than bonuses that reward the act of joining. Cash signup bonuses reward new distributors for signups and do not require sales conversions. These types of bonuses reduce long-term engagement because they only flare initial excitement. They do not help activate selling or team building behaviors.
Rank advancement bonuses make it necessary for distributors to perform and bring out results that predict long-term success. A compensation structure laid on performance-based rewards means that the company is selecting higher-quality distributor groups at the entry point itself.
Strategic insight
The best compensation plans boost activation rates than recruitment volume. A distributor who earns their first commission within 14 days of joining is more likely to stay active even after six months.
The economics behind retention vs recruitment
The annual distributor retention rate in the industry is between 10-20% and the overall turnover in many organizations is 50-75%. This also one thing that the companies do not look at when building their compensation strategy. In such a condition, an MLM company with a 60% churn rate must recruit 60,000 distributors to maintain their network strength.
This is the cost that companies pay when compensation strategies are built on assumptions. When plans highlight recruitment, distributors join motivated by the promise of income but after just one disappointing commission cycle or their first month they feel that the plan has become less generous than proposed during the time of recruitment.
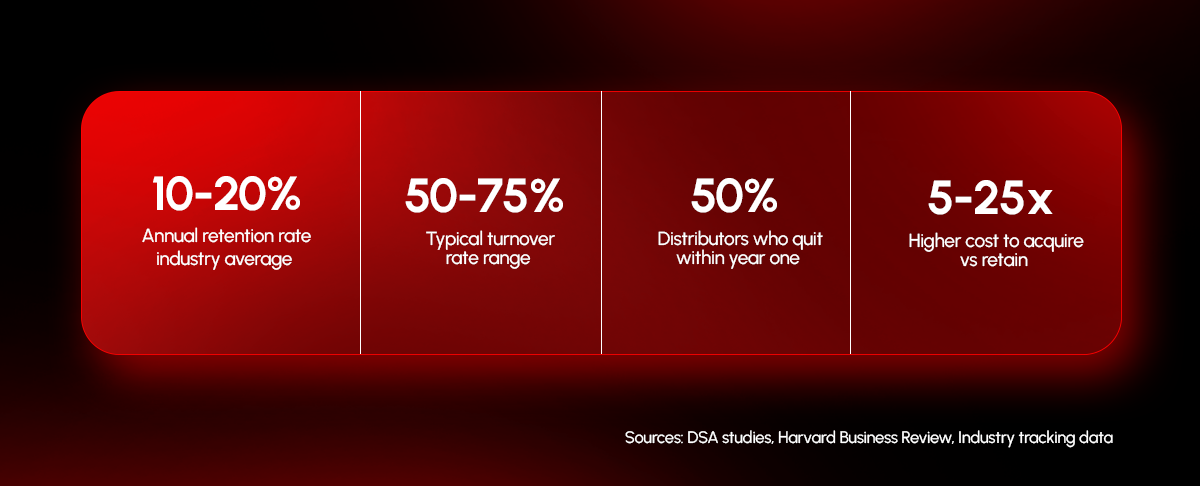
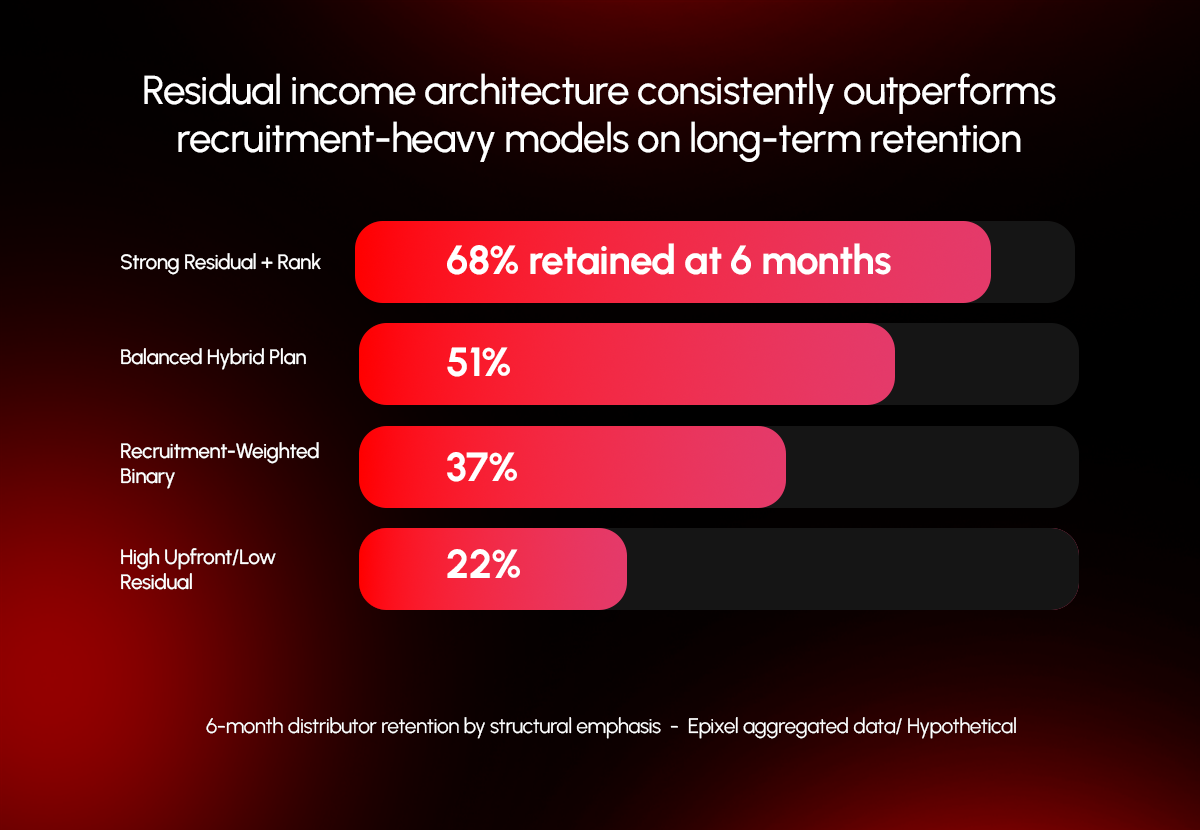
MLM leaders must pay attention to three important patterns.
- Compensation plans that focus too much on upfront bonuses see higher distributor attrition rates. Early cash rewards may motivate distributors but do not encourage behaviors like selling or team building needed for long-term success.
- Distributors stay active longer when they earn consistent income. Continuous earnings encourage distributors to perform better and for the long-term.
- Complicated compensation plans also reduce retention because distributors find it difficult to understand how they earn money and in due course engagement and performance declines.
Strategic insight
Retention balance is more important than recruitment spikes. Even a five percentage point improvement in 12-month retention can reduce acquisition cost by 15-25% without changing the recruitment strategy.
More opportunities through fair earnings distribution
Income distribution data from the direct selling industry plays a major role in the compensation design process. But companies often ignore or overlook this aspect. This importance is underlined by an analysis done by FTC in September 2024 which analyzed over 70 income disclosures. They concluded that most participants earned $1,000 or less per year which is less than $84 per month excluding business expenses. In at least 17 out of the 70 companies analyzed, most participants did not receive any income.
We say this is important for plan designers because these figures also represent customers disguised as distributors for personal discounts but do not involve in team building. What we need to know is the actual earnings distribution among active distributor segments.
| Distributor segment | Definition | % of registered base | Avg monthly earnings | Revenue contribution |
|---|---|---|---|---|
| Inactive | No sales in 90 days | 45–55% | $0 | <2% |
| Casual | 1–3 sales conversions per quarter | 20–28% | $40–$120 | 8–12% |
| Active builder | Consistent sales and recruitment volume | 12–18% | $350–$900 | 28–35% |
| Leader | Excel at rank qualification and team volume | 3–6% | $1,800–$8,000+ | 50–60% |
The Gini Coefficient can be set as a standard measure of income inequality in direct selling. Median Gini Coefficient for the direct selling industry is 0.62 which indicates a significant income concentration. In developed markets the range falls between 0.28–0.41. This itself is not problematic but what matters is whether the compensation plan creates equal opportunities for active distributor population.
Strategic insight
Healthy compensation plans distribute opportunities evenly. MLM companies can call it an achievement when 15% of inactive distributor segment starts generating casual earnings.
Motivational architecture of rank advancement
Rank structures is an inspiration for aspirants in MLM networks that motivates distributors to invest more time and effort to build larger teams and make career progress. When rank structures work they create a self-sustaining growth cycle and when they fail the consequences are severe.
When distributors feel that the rank ladder is difficult to climb, they leave and when they leave they take their downline teams with them. Hence, it is not about how many ranks you create but about how progression criteria are set or are they based on real-world distributor performance.
| Representative rank advancement funnel | |||
|---|---|---|---|
| Rank level | Representative population | Cumulative drop-off | Key risk |
| All registered distributors | 100% | — | Entry barrier |
| Entry rank (Rank 1) | ~52% | 48% never advance | Activation failure |
| Mid tier (Rank 3) | ~28% | 72% stall here | Stagnation zone |
| Senior rank | ~11% | 89% do not reach | Rank compression |
| Leadership rank | ~4% | 96% do not reach | Motivational void |
| Top executive rank | <1% | 99%+ never reach | Aspirational only |
The funnel shows interesting data for plan designers. The deepest motivation problems happen between entry ranks and mid-tier ranks. But the solution is not to make ranks easier to achieve because that destroys the aspirational value. The gaps between ranks must be sealed with micro-milestones like activity-based recognition, interim bonuses for specific achievements, and transparent progress trackers.
Strategic insight
Ranks must be designed in such a way that it motivates distributors at every level and for this they need a visible and believable progress structure.
Discover how we build resilient businesses with advanced MLM functionalities



Effectiveness of various bonus types
Compensation plans contain six to twelve bonus types. Only very few leaders can differentiate bonuses that generate revenue from the ones that only increase payout costs without any business benefit. This is one of the most critical profitability leakage sources in the industry.
| Bonus type | Behavior driven | Revenue impact | Retention impact | Profitability | Risk factor |
|---|---|---|---|---|---|
| Fast Start Bonus | Early activation | High | Low | Medium | High if uncapped |
| Residual / Unilevel | Ongoing volume | Medium | Very High | High | Low |
| Matching Bonus | Leadership mentoring | Medium | High | Medium | Medium |
| Binary Cycle Bonus | Leg balancing | High | Medium | Medium | High (cap dependent) |
| Leadership / Rank Bonus | Advancement | High | High | High | Low |
| Pool / Global Bonus | Top performer incentive | Low (direct) | High (aspirational) | Medium | Medium |
| Lifestyle Bonus | Status signaling | Low (direct) | High (identity) | Medium | Low |
Strategic insight
All types of bonuses do not create equal value for the business. The most dangerous ones are those that create distributor excitement without cultivating selling behaviors that can create a sustainable revenue opportunity for the company.
The health of network structure
The structure of your compensation plan naturally creates reward behavior. Each plan, be it binary, matrix, or unilevel, have their own unique structural capabilities that help create behavioral nudges across your MLM network. Binary plans create incentives for teamwork and leg building but can sometimes weaken the network structure when one leg outperforms the other. This leg imbalance causes binary collapse where leaders in the weaker leg disengage which in turn reduces volume and commission payout for upline leaders.
| Network health metric | What it measures | Healthy signal | Red flag |
|---|---|---|---|
| Leg Imbalance Ratio | Volume differences between binary legs | Below 60/40 split | Sustained 75/25+ split |
| Duplication Rate | % of distributors who sponsor ≥2 active members | >35% | <18% |
| Spillover Dependency | % relying on upline placements for volume | <20% | >40% |
| Compression Effectiveness | % of volume reaching qualified upline levels | >85% | <70% |
Strategic insight
Compensation plans build network behavior than training. A distributor asked to balance a binary structure will learn teamwork because the plan demands it and not because any training program taught it.
Commission leakage: A threat to profits
Commission leakage is one of the most underdiagnosed profitability problem in direct selling. It does not alert the business or appear in business reports. It is something that accumulates silently across thousands of payout transactions in the form of rounding off errors, qualification mismatches, compression inefficiencies, undetected duplicate accounts, or overpayment errors.
| Commission leakage risk assessment | ||||
|---|---|---|---|---|
| Leakage source | Frequency | Avg. margin impact | Detectability | Risk level |
| Payout cap overrun (Binary) | High | 0.8–2.1% | Moderate | High |
| Compression misconfiguration | Medium | 0.5–1.8% | Low | High |
| Qualification threshold ambiguity | High | 0.3–1.2% | Moderate | Medium |
| Duplicate/ghost accounts | Low–Medium | 0.2–0.9% | Very Low | Critical |
| Breakage (unclaimed/expired bonus) | Medium | 0.4–1.0% | High | Low |
| Matching bonus depth creep | Medium | 0.6–1.5% | Moderate | High |
Average loss from commission leakage from these issues can be somewhere between 3-8% of total payout. Most leakages are not the result of fraud or manipulation, in some cases they may be caused due to plan complexity and inefficient implementation on software platforms.
Strategic insight
Most MLM companies suffer commission leakage because of their compensation structure. Even though it consumes a smaller margin between 3-8%, with millions of payout transactions it multiplies causing profit destruction.
Behavioral economics of incentives
Incentives should be built on the capability to create behaviors that an organization needs. Incentive payout volumes do not matter but what matters is the psychological and behavioral mechanisms an incentive structure activates. Data from distributor behavior patterns show consistent outcomes like activity increases just before a bonus qualification period, engagement declines are sharp in the 30-60 day post join period, and in the 14 days after a failed qualification attempt. Consistent distributor activity is formed through incentive structures that build habits as opposed to event-based incentives.
| Behavioral mechanism | Its impact on plan design | Short-term effect | Long-term effect |
|---|---|---|---|
| Loss aversion framing | Protects distributors from losing rank benefits. | High activation | Medium — stress-driven |
| Progress visibility | Real-time progress through rank meters and commission dashboards. | Medium | High — goal gradient |
| Social proof + recognition | Recognize achievement through ranks, leaderboards, and rewards. | High | High — identity formation |
| Variable reward schedules | Use surprise incentives to create excitement and urgency. | Very high | Medium — dependency risk |
| Fixed monthly residual | Offers stable unilevel or residual commissions. | Low excitement | Very high — trust building |
Strategic insight
Compensation plans should not stay as payouts. It must create behaviors that benefits an organization in its growth journey.
Compensation plan complexity destroys trust
The inverse relationship shared between distributor trust and compensation plan complexity can create serious consequences for an organization. When a distributor cannot understand a rank structure or predict their earnings, suspicion and confusion grows. They assume that the company has deliberately designed the compensation plan to mask lower earnings as generosity.
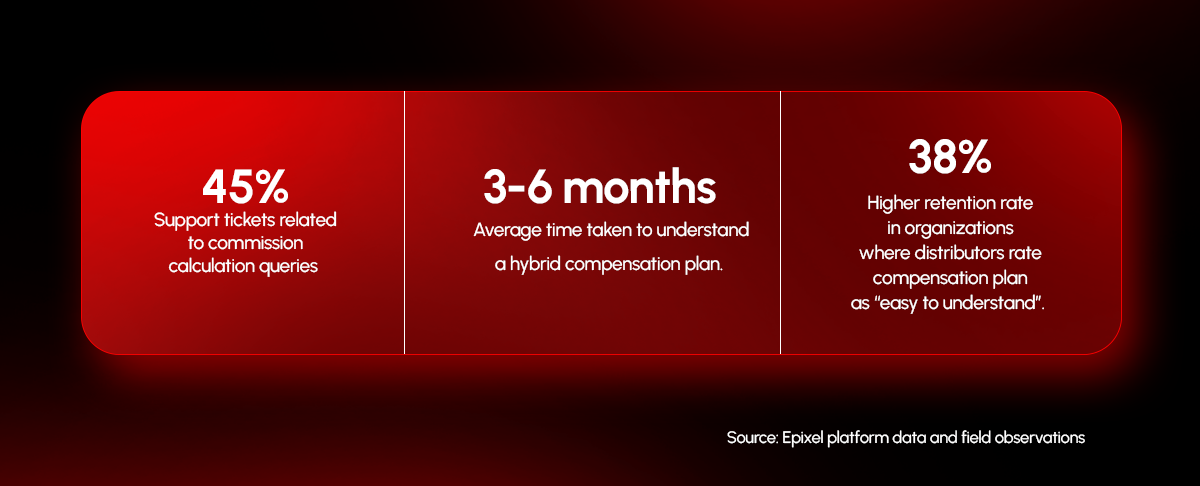
This does not mean that the plans must be simple, hybrid structures are necessary. This means that even if there is complexity it should not affect distributor understanding. Even when the payout logic is complex, distributors should know how to earn more.
Strategic insight
Complexity is a villain that destroys trust faster than low commissions. A distributor who earns $100 less with an easy-to-understand compensation plan will outperform and outlast a distributor who earns $100 more with a plan they cannot explain.
Geographic and industry compensation plan variations
One of the expensive mistakes an MLM company makes is to implement a compensation plan that was designed for one market or product category to a whole network with different behavioral and economic characteristics. Every region and industry needs its own incentive structures, recruitment strategies, and rank advancement criteria.
| Region | Dominant incentive preference | Recruitment velocity | Primary motivation factor | Key risk factor |
|---|---|---|---|---|
| North America | Lifestyle + Rank title | Moderate | Entrepreneurial identity | Regulatory scrutiny |
| Asia-Pacific | Group bonuses + Family income | High | Shared growth | Market saturation velocity |
| Latin America | Fast cash + Social mobility | Very high | Income opportunity | Currency fluctuations |
| Europe | Residual income + Transparency | Low–Moderate | Supplemental financial security | Compliance requirements |
| Sub-Saharan Africa | Community + Product value | Moderate | Multiple income streams | Infrastructure limitations |
Strategic insight
A compensation plan that performs well in Europe may fail miserably in Africa. Hence adapting compensation plans is not just a part of your localization strategy but an essential step to achieve long-term success and stability.
AI-powered predictive compensation intelligence
Predictive systems in compensation plan analytics use distributor behavioral signals to predict outcomes and help organizations design effective intervention strategies. Technically advanced direct selling organizations are implementing advanced compensation analytics systems to plan, build, and optimize their compensation structures.
Analyzing distributor behavior can predict distributors at the risk of churn, those performing excellently, and the bonus structures that are bringing in intended outcomes.
| Behavioral signal | Detection window | Predicted outcome | Recommended intervention | Retention impact |
|---|---|---|---|---|
| No sale in 14 days (post-join) | Days 14–21 | High churn risk (60–75%) | Offer training and early bonus support. | +22–28% |
| 3 recruits in first 30 days | Day 30 | High retention probability | Help distributors reach the next rank faster. | +35–45% |
| Login frequency drop >50% | Any 2-week window | Disengagement signal | Send personalized re-engagement rewards. | +15–20% |
| First failed rank qualification | Post-qualification period | 48-hour churn spike | Encourage progress and acknowledge effort. | +18–25% |
| Consistent monthly reorder | 3-month pattern | Long-term activity predictor | Reward loyalty with ongoing incentives. | Foundational |
Strategic insight
Future of compensation plan design lies in predictive, adaptive, and data-driven systems. Companies that implement them and treat them as a living behavioral system will lead the next decade.
Compensation plan simulation
The direct selling industry has seen plans that looked excellent on paper yet failed miserably after. This happens because executives often overlook the most important process in compensation plan design is to stress-test the model before implementation. When the plan is tested before launch, even minor risks identified will have backup strategies that save revenue and profits. Companies can easily do this with either a Compensation Plan Stress-Test Workbook or an advanced Compensation Plan Stress-Test Simulator.
| Scenario | Key assumption | Commission burden | 12-month retention | Profitability outlook | Sustainability |
|---|---|---|---|---|---|
| Aggressive growth | Focus on rapid recruitment and high upfront rewards. | 47–52% | Low (18–24%) | Short-term positive, long-term fragile | 12–18 months |
| High retention model | Focus on residual income and steady growth. | 40–44% | High (52–68%) | Sustainable positive | 5+ years |
| Low-margin environment | Operate under pricing pressure and lower margins. | 35–40% | Medium (30–42%) | Tight but positive | 2–4 years |
| International expansion | Adapt plans for different currencies and markets. | 41–47% | Variable by market | Market-dependent | Requires local optimization |
Strategic insight
Compensation plans must be stress-tested like financial systems. The cost of a simulation is extremely small when compared to the cost of a restructure after it damages distributor trust.
Distributor sentiment and trust are the invisible KPIs
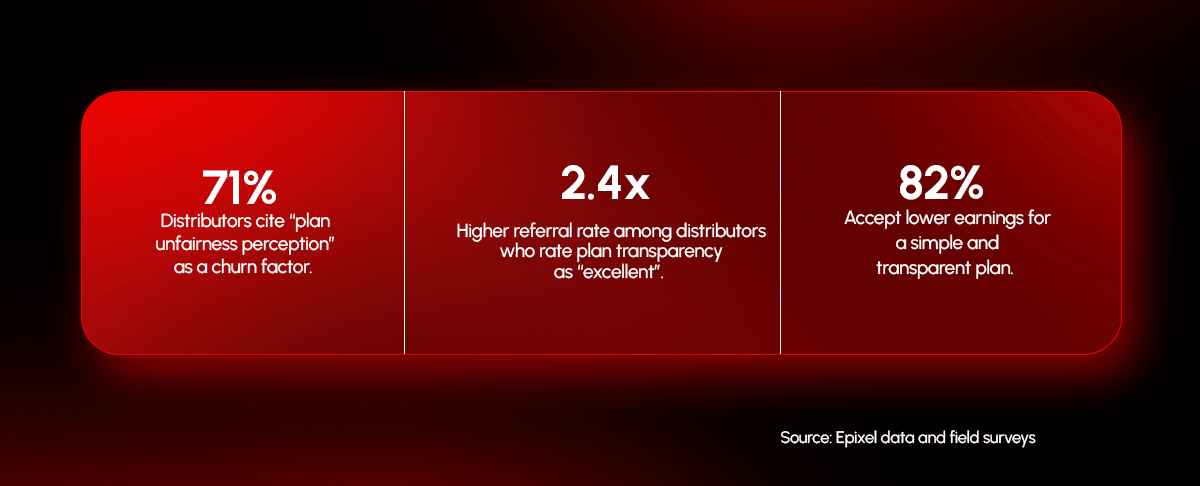
A distributor’s decision to refer a friend, stay in the business, or invest more time is dependent on the plan’s fairness and their actual earnings. Transparency becomes key to mold distributor perceptions of the compensation plan. When distributors understand how they earn, why they earned so much, and the rank qualification rules, their satisfaction levels improve even during months with low earnings. Opaque and complex plans create resentment and results in distributors leaving the company altogether.
Strategic insight
Fairness perceptions of distributors matter more than payout size. Fair compensation plans build trust and a loyal distributor network.
Longitudinal cohort analysis
The best way to evaluate a compensation plan is to analyze the behaviors of different distributor groups over time. The revenue contribution, churn patterns, and rank progression of each distributor cohort are core metrics that needs to be tracked in longitudinal cohort analysis. When aggregate statistics is considered, these patterns may not be revealed.
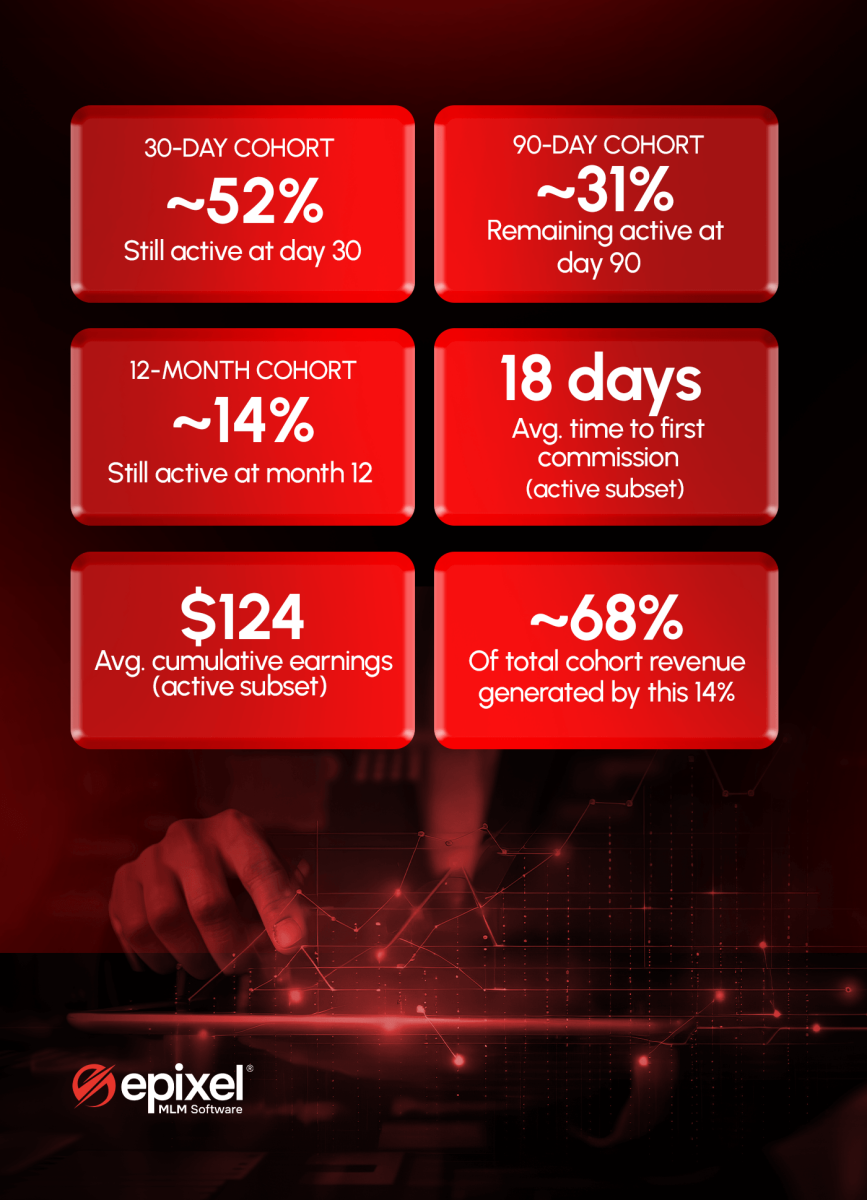
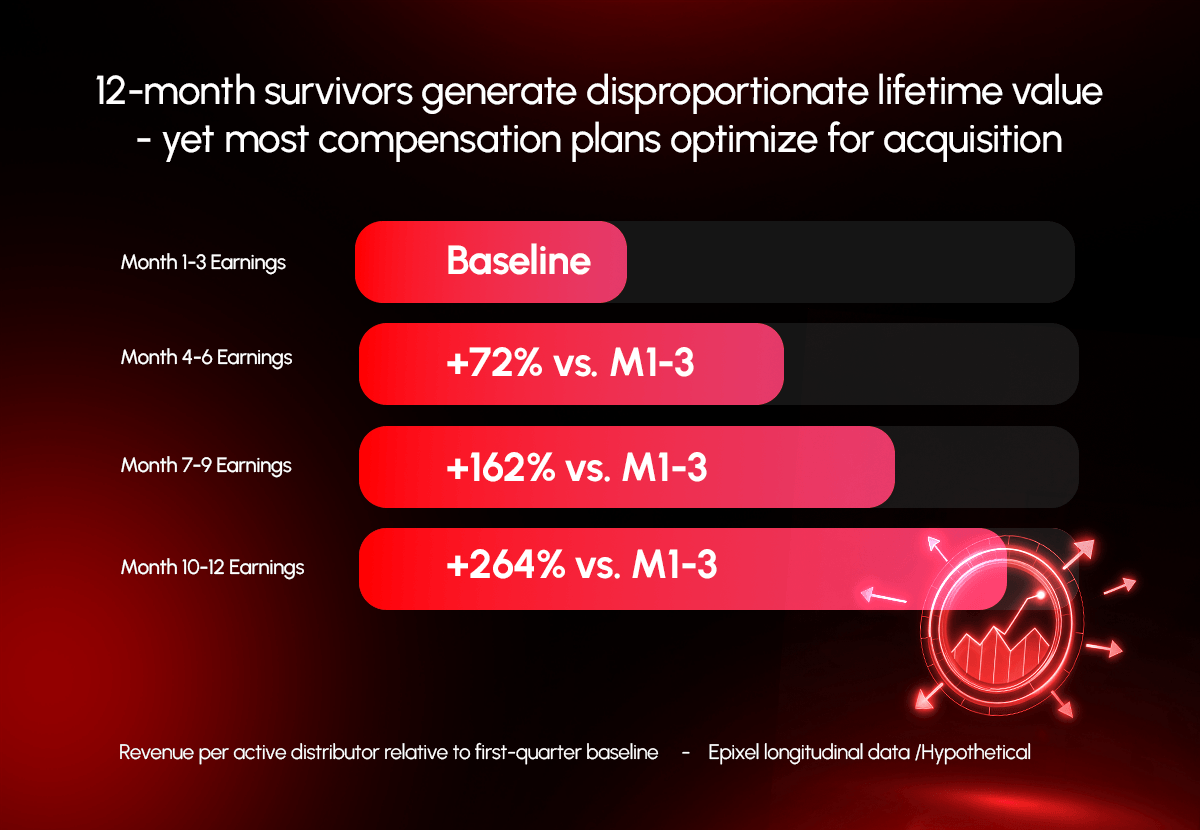
When looking at the data, it provides a strategic insight. Distributors who stay until 12 months are valuable because they bring more revenue per quarter. Their network is structurally strong, their sales skills have developed, and their product knowledge have widened.
Strategic insight
Most compensation plans are optimized for acquisition rather than lifetime value. The distributor who costs the most to recruit is just a fraction of the cost of the distributor lost in their eighth month whose departure takes their entire downline with them.
Conclusion
Direct selling companies are designing compensation plans on the foundations that power financial services and technology companies. They use real behavioral data, predictive analytics, and treat payout architecture as an economic system.
Seven strategic imperatives for compensation design
- Profitability should be measured at the distributor segment level, aggregates won’t offer much help.
- Design a plan in which distributors stay active longer. Do not concentrate on recruitment volume.
- Consider retention as a focus strategy.
- Evaluate your bonus structure for behavioral value than payout cost.
- Implement a system to detect commission leakages.
- Create simple and transparent plans.
- Stress-test all plan change through simulation before implementing.
Companies that design compensation plan on behavioral data and test and optimize it with the same commitment as in a financial system will see growth and sustainable network structures. Compensation plan building must change from assumption-based to intelligence-based, and fast.
















Leave your comment
Fill up and remark your valuable comment.