


The concept of ranks is core to the success strategy of direct selling companies. Distributors are attracted to the promise of achievements, both in terms of earnings and professional growth. Rank structures, though complex in multi-level marketing companies, influence sales force to perform better. Every rank achievement is considered a realization of their capabilities, and this boosts confidence and motivation. But what happens when ranks fail to serve this purpose?
In the concept of ranks, progress is a hard-earned reality. Because, to move up the ladder effort and consistency are required. Market competition, customer retention challenges, and personal limitations also make rank advancement difficult. Also, systems that are developed to reward performance are designed so strictly that only those hitting the highest standards can climb.
The broken rung and rank failures
Every direct selling company focuses on building rank ladders that motivate distributors to climb higher each day. But often the very first “rung” breaks and gives away to reality. New entrants lose their hopes, rank achievement feels distant, and they quit. A tight rank structure makes leadership ranks look aspirational than achievable. When performers in the top tier lose motivation, the structure crumples and the company suffer.
This article analyzes the realities, opportunities, and limitations associated with rank concepts in direct selling to develop a practical framework to evaluate the effectiveness of your rank ladder. You can identify where the progress drops and interpret difficulty curves to find solutions that help your distributors move forward without a hitch.
Ranks bridge beliefs and budgets
Ranks are more than a compensation concept. It is a belief system for distributors—an untold confidence of success and growth possibilities. For businesses, a rank system is a budget strategy that manages payout distribution. Rank ladders should be simple and achievable right from the first step. When rank rules become confusing or unachievable, distributors lose trust and confidence. At this stage, attractive payouts only look impressive but do not help with distributor progress.
Running a reality check on your current multi-level marketing rank structures can reveal a lot about your MLM business and network.
- Track how distributors move between ranks.
- Compare the performance of different distributor segments across markets or time periods.
- Make decisions based on evidence not assumptions.
Rank being an important component of your payout structure, running reality checks like this purifies your payout process with fair plans, efficient payouts, and leadership growth.
See the ladder clearly with heatmaps and “expected-to” metrics
In order to understand how your rank rules in paper work in the real world, you need granular monitoring of distributor movements in the rank map. Rank climb heatmaps, that way, give a clear indication of your rank’s strengths and weaknesses. Each step toward a rank is monitored to give clear insights on probability of distributors achieving the next rank within a specific time frame, the actual time it takes to achieve the next rank, and the likelihood of a distributor to stay in the rank for a set number of payout cycles.
Using the rank climb heatmap
Rank climb heatmap is a color-coded chart that tracks distributor movements to show network marketing businesses the probability and speed of promotion for each step on a rank ladder.
- Green cells in the heatmap indicate healthy progression.
- Red bands point out to the step where distributors get stuck or drop off.
Businesses must focus on the red bands first because fixing that would improve the strength of the steps that follow.
Compare the strengths and weaknesses of your rank structures with a ready-to-use rank climb heatmap
How to use the template?
- Open the “Inputs” tab and enter the rank list starting from entry-level to leadership-level.
- In “Metrics” tab, select your market, cohort, and time window. These are meant for labeling and analysis. Paste your rank KPI values into the light-colored cells. You can enter data only for the adjacent rank. Non adjacent ranks are grayed out to avoid unrealistic jumps.
- Adjust weights on all three “expected-to” metrics that matter most to you.
- Adjust ranges if your times or rates are outside the ranges mentioned in the template.
- Go to “Heatmap” tab to see a summary of your rank, with green indicating easy advancement and red pointing to steps that need immediate attention. Linked E2P, E2T, and E2S grids give detailed numbers behind the colors.
How to decode heatmap?
- Find the first red band from the bottom. This is your lowest rank where distributors stumble. Fixing this can help improve the consequent rank levels.
- In the red bands, check for E2S. A lower E2S shows that promotions are not lasting. Distributors get promoted but fall back quickly. In order to fix this, you will have to implement “stick chips” which are small incentives which keep people at the same rank or lower minimum requirements to hold the rank.
- Check your E2T. If the time is too long but E2S is strong then understand that the issue is speed, not quality. Simplify onboarding, concentrate on early distributor training, and offer sponsor support for distributors to advance faster.
- Compare distributor cohorts and identify what faster cohorts do to achieve quicker promotions and replicate them. In slower cohorts, identify inefficient practices and replace them.
The expected-to metrics
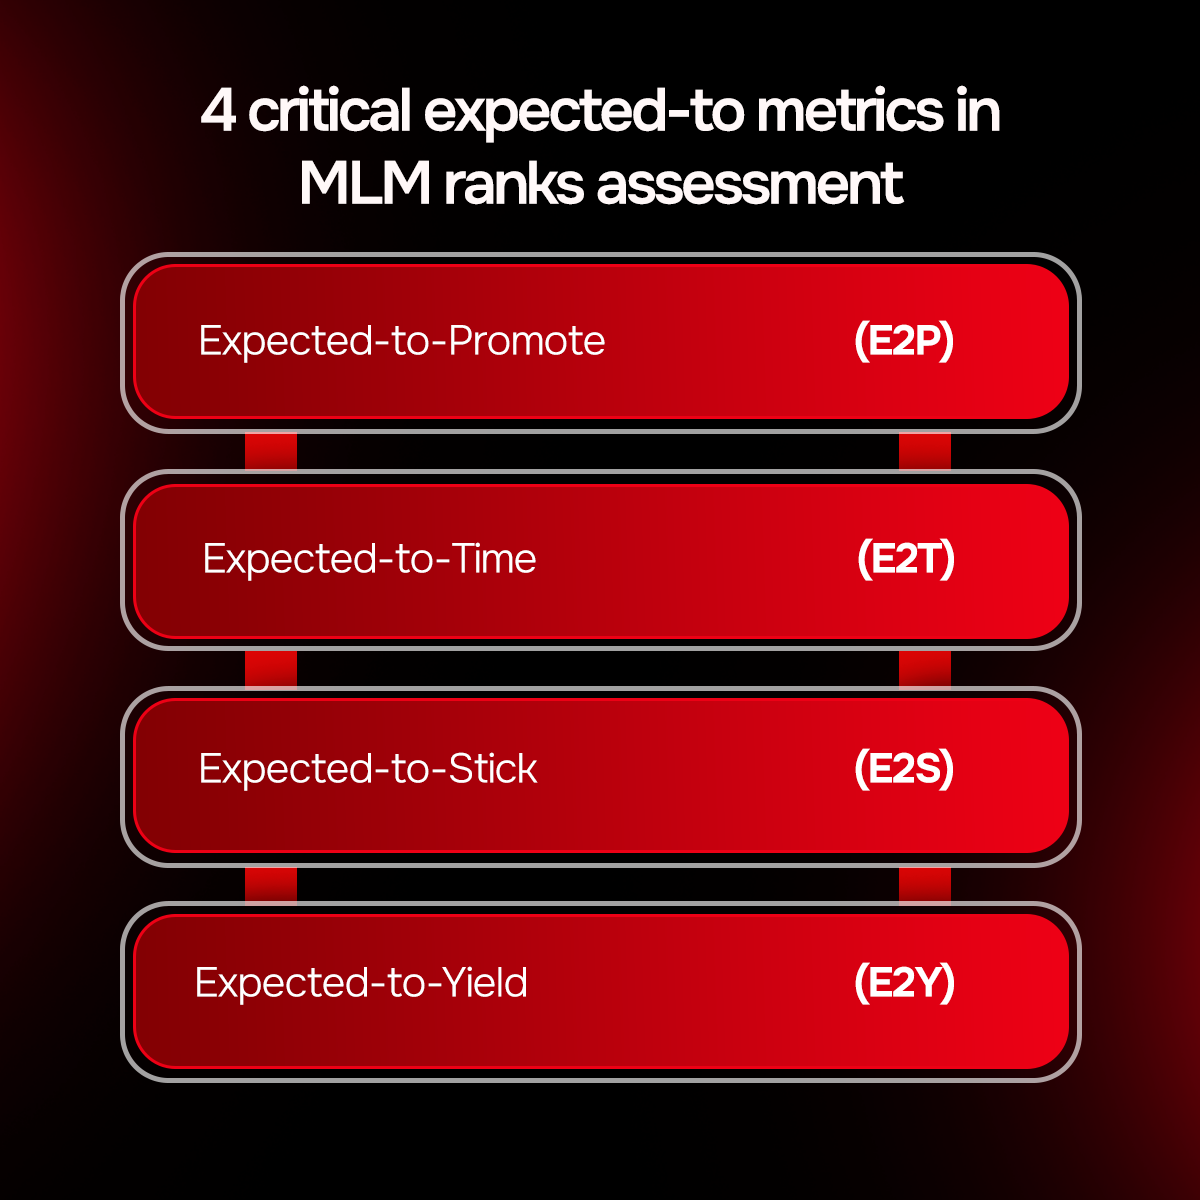
Along with the heatmap, there are four expected-to metrics that help decipher a complex rank promotion process.
- Expected-to-Promote (E2P) which identifies a percentage of a cohort likely to reach the next rank within a set timeframe.
- Expected-to-Time (E2T) which measures the time taken to achieve a rank promotion under practical circumstances.
- Expected-to-Stick (E2S) which measures how many distributors remain in their new rank for how long.
- Expected-to-Yield (E2Y) indicates how much revenue they bring (personal + team) during the time of promotion to ensure promotions are related to meaningful revenue.
If your E2P (more people moving up) and E2T (they move up faster) is improving at the tough red steps with E2S steady or rising, then your rank ladder is speeding up and becoming stronger without risks.
Cohort intelligence
The third and the final pillar of a rank strategy is cohort intelligence. Different groups behave differently. Understanding the differences tells you what needs fixing and what should be replicated. Identifying the segments is the first step. Distributors can be classified based on the time they joined, the enrollment package they chose, the market they are in, or the sponsor they are under. Distributor segments who move faster up the rank ladder adopt simple and repeatable practices with easier early qualification, structured first 30-day actions, and regular short sponsor support sessions.
Executing the intelligence
- Assign each red zone in the heatmap with an owner who will shoulder the responsibility and draft a practical action plan.
- Concentrate on the first red band, this is the entry level blockade for distributors. Once that is fixed, the rest solves itself.
- Track the four expected-to metrics together to balance speed, volume, and stickiness instead of chasing shallow wins.
- Compare cohorts to refine training and localization instead of changing the whole global plan.
Measuring ROI with a rank bottleneck ROI planner
The rank ROI planner template converts the red band insights into a clear business case. Instead of guessing which action will help, you can directly see the expected impact on promotions, revenue, and expenses.
What it does
- You provide data on current rank performance.
- Choose an intervention such as simplifying rank qualifications, sponsor support, or a bonus to improve retention.
- Define adoption estimates i.e., how many distributors will follow it.
- The template will calculate
- Incremental promotions
- Stickiness (E2S)
- Sales/volume (E2Y)
- Total cost of intervention
- ROI and payback period
How to use the template in five steps
- In the INPUTS tab, enter the rank step and E2 metrics with number of distributors who are eligible.
- List interventions (up to 5 possible actions) under the Intervention Catalog with expected improvements in your metrics and related costs.
- Under adoption scenarios, specify how many distributors will adopt each intervention for low, base, or high scenarios.
- In the CALC tab, select the intervention number to simulate its impact.
- Go to ROI SUMMARY to compare the results of low, base, and high adoption results to see which intervention brings the highest ROI.
Decision tips
- Select interventions that show positive ROI even at low adoption.
- Ensure (E2S) improves or at least holds for two pay cycles.
- If the main problem identified is the time-taken-to-rank (E2T), focus on training and onboarding improvements than cash bonuses or rewards.
- Implement one rank transition per market at a time.
Turn heatmap insights into smarter rank advancement decisions with rank bottleneck ROI planner template.
Build a rank strategy from heatmaps to habits
Rank insights hold value only when they are rightly implemented. Heatmaps and expected-to metrics with regular reviews, transparent communication, and cross-functional governance, network marketing companies can move from analysis and identification to creating sustainable improvements.
What you should measure and how often
- Track activities of each distributor every week or month.
- Analyze if they have progressed, stayed in the same rank, or dropped off.
- Record supporting data such as personal sales, team volume, retail customers, training completion, and sponsor support.
- Measure rank structure efficiency using a heatmap and regularly monitor expected-to metrics (E2P, E2T, E2Y, E2S).
How to process insights into action
- If early ranks are red, understand that there is a problem with your rank structure that is causing confusion and difficulty for distributors.
- You can fix it by simplifying rank qualifications, ensuring minimum sales requirement to recruitment, and mandating sponsor follow-ups.
- Implement mobile applications to nudge distributors with small tasks or targets that can guide them slowly to climb up the rank ladder.
- If middle ranks are red with low E2S, then it signifies that distributors progress to new ranks but do not stick for more than one pay cycle. Retention policies should be added to ranks whereby a distributor reaching a particular rank should hold onto it for at least two consecutive pay cycles. Also, make retail sales as a compulsory qualification criterion so that rank advancements are based on sales together with team volume.
Governance with continuous improvement
- Run a review with monthly refresh of heatmap and expected-to metrics with recent data.
- Point out clearly where things improved and where they fell flat.
- Do not try to fix the whole of your rank structure at once. Choose one rank or step at a time for a specific market, read the results, and then proceed.
- Set up a quarterly council with leaders and experts fron various teams related to products, field, finance, and compliance.
- Let the council review the heatmap and metrics quarterly and choose one or two improvements to test.
- Let them design goals, set a budget, and create rollback rules to see expected results.
Focusing on minor improvements step-by-step prevents change fatigue that could be created by constant rank adjustments among distributors.
Guide the field through the change
Communicating the changes and providing the field with transparent explanation of each change builds trust.
- Depict changes as clear, fair, and reliable.
- In the initial stage, test it with top leaders to show distributors the before-and-after results.
- Integrate micro-training sessions into their daily routine.
- Publish top Q&As every month so that evidence rules not rumors.
Key points to consider in designing your rank strategy
- Track consistently to ensure that your rank progression process is governed by reliable data.
- Fix risks with speed and quality in mind.
- Make it a standard practice to review the metrics with a quarterly design council to reduce change fatigue and accelerate improvements.
- Communicate every minute change to your network for fairness and transparency in the process.
Discover how we build resilient businesses with advanced MLM functionalities


Safeguarding the rank ladder against assumptions, realities and limitations
A common assumption about rank structures is that with increasing level of complexity, compliance holds. But in reality, simpler, less confusing rank rules strengthen compliance. Make your rank rules clear, fair, and ethically strong with criteria based on real customer sales and rank retention rules.
Most MLM teams believe that rank reality check works best with huge sets of data. In fact, the first version of a rank reality check only needs weekly reports of rank status, sales, real customers, training participation, and churn to create reliable heatmap and expected-to metrics.
Leaders on the top tier feel that simplifying early rank levels dilutes achievement. But a fair rank ladder that many can climb helps build strong teams and opens leadership opportunities at higher levels. Some red bands you see in the heatmap are real leadership gates. These should remain as it is because our goal is to remove unnecessary friction, not lowering the standards.
Steps to protect your rank ladder
- Prevent sudden payout increases by reducing "late rank jackpots" with early "bottleneck breakers" to keep your payout budgets under control.
- Set goals and do not change criteria that should remain challenging.
- Ensure data quality with regular monitoring, deduplication, and policy versioning.
- Reduce cultural resistance by testing one or two confident improvements with top leaders before implementing it across the whole network.
- Reward rank stability over achievement speed.
Let your distributors climb with confidence and rise with speed
Firstly, design a rank ladder that distributors can climb not stop and admire. Once it works, focus on speeding up advancement. Guide your progress with heatmaps and expected-to metrics to track movement, whether it is fast or slow, advances or stalls. Take the past 12 months data to create a baseline heatmap. Pick one priority transition that should be improved in the next 90 days. Publish the change and set clear improvement goals in your E2 metrics. Repeat the process every quarter.
A fair and clear rank ladder brings belief and trust into your system. When distributors understand progress is possible they are motivated and perform better. It also provides accurate revenue forecasts and makes compliance an easy chapter.
References and methods: This article is created based on internal data with weekly or monthly rank status, personal and team sales volumes, retail customer numbers, training and onboarding results, churn alerts, and policy changes. The movements between ranks and four expected-to metrics (E2P, E2T, E2Y, E2S) are measured to give you a heatmap that shows where progress is stuck and a clear guide to refer what to do next.


Leave your comment
Fill up and remark your valuable comment.