
















Download Free Subscription Health Dashboard
Multi-level marketing often has a hard time guessing and tracking the subscription health when it's a large pool of subscribers. Companies may be unsure about the early signs of losing subscribers. As the company expands, it will be complicated to go through a dozen spreadsheets, and analyze which promotion drives the highest number of subscribers.
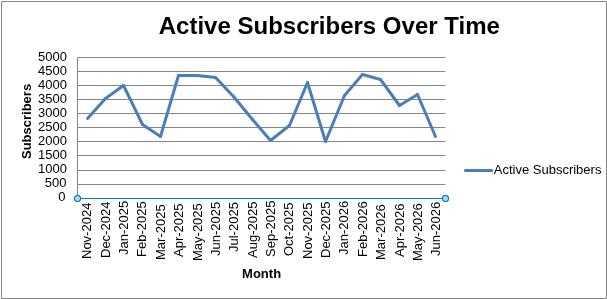
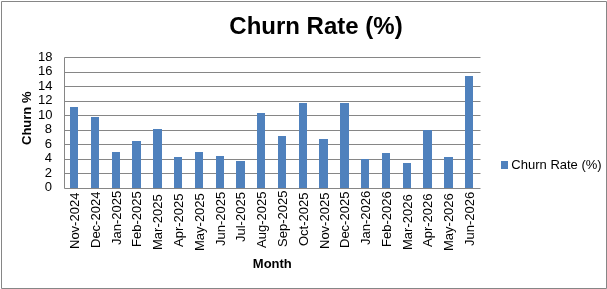
Hence, it's essential to have a single spreadsheet which calculates and displays all the important KPIs that include the number of active subscribers, churn %, which cohort of subscribers stay longer, and monthly recurring revenue (MRR). The workbook refreshes in minutes and seamlessly integrates with all the major platforms like Epixel MLM Software and even your in-house SQL exports.
Use a single spreadsheet that contains essential KPIs to ensure subscription health.
*No email required.
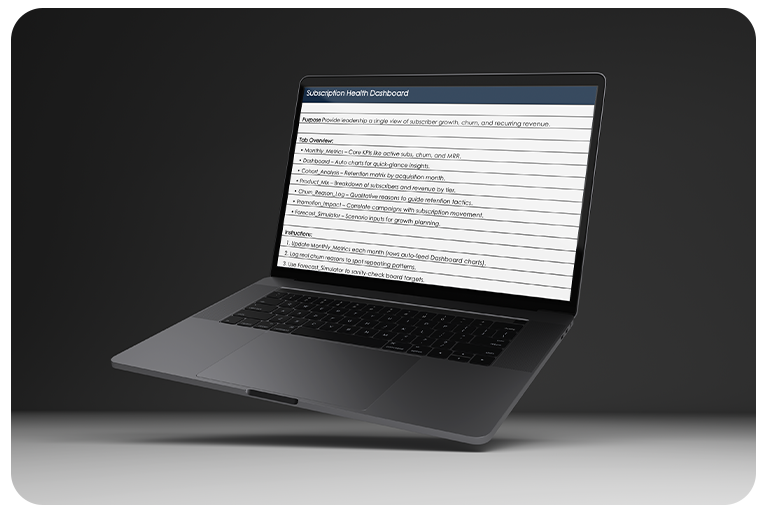
What’s inside the free Subscription Health Dashboard
| Tab | Purpose |
|---|---|
| Intro | Provides a one-page quick-start guide along with a clear data dictionary to help users understand inputs, metrics, and definitions before using the dashboard. |
| Monthly_Metrics | Tracks core subscription KPIs such as active subscribers, new subscribers, churned subscribers, churn percentage, and Monthly Recurring Revenue (MRR) on a monthly basis. |
| Dashboard | Displays automatically generated line and bar charts that give executives a high-level view of trends, performance, and overall subscription health. |
| Cohort_Analysis | Shows a six-month retention matrix organized by acquisition month, making it easy to identify subscriber stickiness and drop-off patterns. |
| Product_Mix | Breaks down subscriber counts and MRR across Basic, Standard, Premium, and VIP tiers to highlight revenue contribution by product level. |
| Churn_Reason_Log | Captures qualitative reasons for subscriber cancellations and links them to estimated lifetime value impact for deeper churn insights. |
| Promotion_Impact | Analyzes how campaigns such as flash discounts, referral bonuses, and plan upgrades affect net subscriber additions and revenue. |
| Forecast_Simulator | Enables “what-if” scenario modeling to test board-level targets, growth assumptions, and investor revenue projections. |
Who will benefit the most from this dashboard?

CMOs and Growth Leads: CMOs are the ones who spend and focus heavily on acquiring customers. But they are doubtful about whether the amount spent will turn into long-term subscribers. Since this dashboard contains all necessary KPIs it helps them evaluate the promotions that bring loyal subscribers, compare growth of new acquisitions against churn losses. It helps them decide whether to spend the money on retention programs or securing new leads.
CFOs and Finance Controllers: Financial leaders want reliable numbers to predict and defend their numbers at the time of audits. With this dashboard they can track monthly recurring revenue, identify the revenue risk early when losing subscribers increases. The dashboard helps them predict revenue after analyzing the common behaviors of each batch of subscribers.
Field Development and Success Managers: This dashboard gives them visibility on which problems matter the most. They will be able to identify the groups which are churning faster. It will help them focus better on high value subscribers and spot early signs of subscription cancellation.
Consultants and Fractional Execs: The consultants are in charge of presenting board-ready insights and convincing the executive team. They can upload their client on this dashboard and retrieve insights around churn, retention, and MRR. The presentation-ready format enables them to provide recommendations confidently and earn credibility among their clients.
Investors and Advisors: Investors look into the retention quality and evaluate the longevity of the MRR. Investors can use this spreadsheet to take a quick glance and spot the hidden issues behind certain promotions. It answers their question on whether this subscription is built to last.
Click to download the free subscription health dashboard to check whether a promotion is sustainable by evaluating the churn %
*No email required.
Why this subscription health dashboard works
Conventional spreadsheets take up most of the setup time to clear the data. But this workbook contains US-based sample data derived from real world experience. It will easily help you understand how each metric behaves, assess churn, retention, and MRR rates, and learn how each promotion affects revenue.
The dashboard isn't built from theoretical assumption rather it is based on more than two decades of real-world patterns. It contains the KPIs which leaders ask for, fields that assess the impact of different promotions and distributor behavior. It is designed considering the common mistakes typically seen in the network marketing industry.
You can export CSV data from any CRM platform or commission engine and copy-paste the data. Refresh the sheet and the insights will be available within minutes.
It's an action-focused workbook. Hence it contains visualized ways of conveying performance. There are ROI files to judge whether some promotions are worth it. Such strategic practices help companies to upgrade their subscription strategic without grave financial risks.
Download a dashboard to access insights on subscription upon exporting the CSV data from your CRM platform.
*No email required.