















Download Free AI-Driven MLM Lead Scoring Blueprint
A one-time click or website visit by a customer doesn't mean the customer is a potential lead, by default. The sales team often chases the wrong leads who never intended to buy the products. This hinders the growth of the company as effort and time are lost tracking their interests. In such scenarios, our AI-driven lead scoring blueprint will categorize common customer actions under the labels such as hot, warm, and cold. Along with this, the workbook estimates and predicts how much a customer will buy in the future. This will help the sales team prioritize their leads and know whom to focus on more.
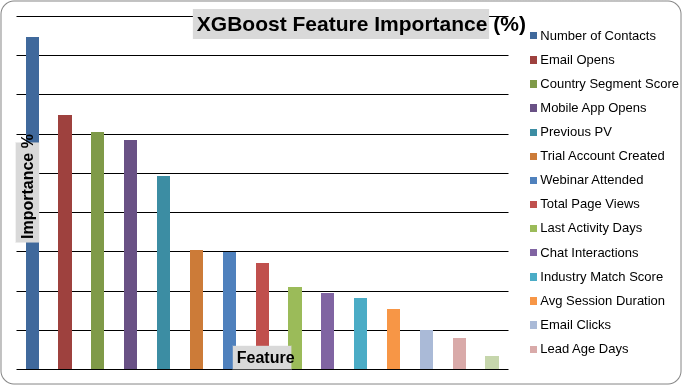
This template comprises cutting-edge tools like the feature-importance charts (XGBoost) which predict what behavior matters most for sales. JSON API is used in the workbook to calculate the AI score against each customer and the scores are sent back to your CRM platform for the sales team. A visual flowchart called the mermaid diagram is used to convey to the business and tech teams where the data comes from, where it goes and how fast it gets updated in the CRM tool.
The process is made easier for the companies as they only have to export and upload their CRM data as CSV files. The chart and scores get updated automatically.
Categorize customer actions with a single weighted score to identify potential leads.
*No email required.
What’s inside the free lead scoring blueprint
| Tab | Purpose |
|---|---|
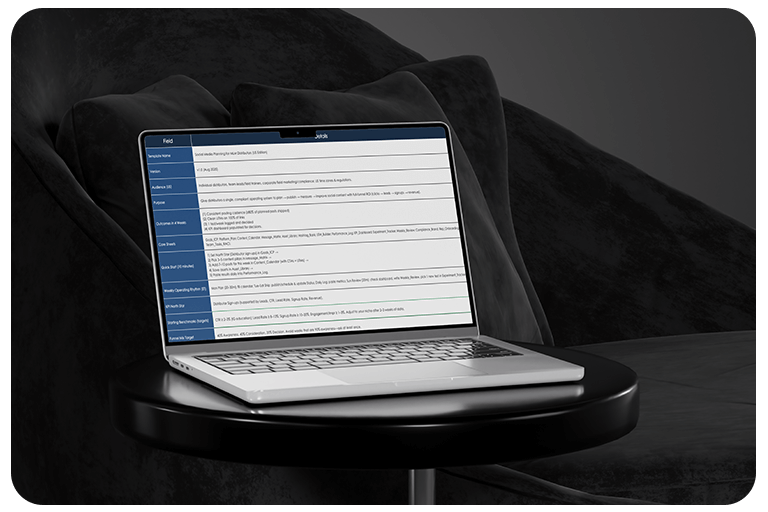
| Intro | Provides a quick-start guide so users know how to use the workbook right away. It also explains what each tab means to avoid confusion. |
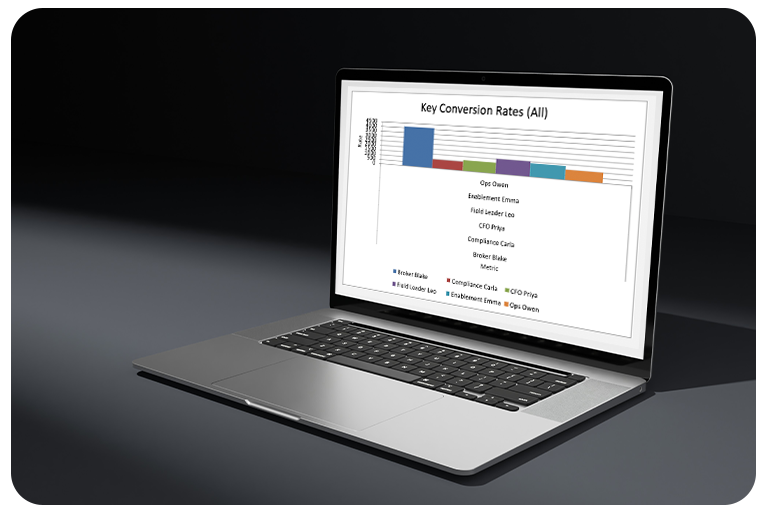
| Feature_Importance | Shows which data points influence lead scores the most using ranked XGBoost weights. A bar chart makes it easy to visually compare what really drives conversions. |
| Sample_Leads | Displays 20 demo leads with predicted Hot/Warm/Cold tiers and expected PV values. This helps users understand how scoring looks before adding real data. |
| API_Spec | Gives a ready-to-use JSON schema for sending scores back into the CRM. Developers can copy and paste it directly to speed up integration. |
| Mermaid_Diagram | Maps the full data flow from data sources to real-time CRM updates in a single architecture diagram. The format is Markdown-friendly for easy documentation and sharing. |
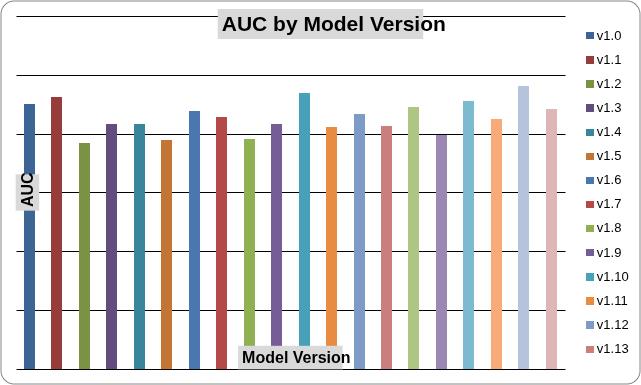
| Model_Metrics | Tracks model performance using AUC, precision, and recall across different versions. A bar chart helps teams compare improvements over time. |
| CV_Results | Shows how the model performs across multiple cross-validation folds. The Lift @ 20% chart indicates how well the model identifies top-quality leads. |
| Attribute_Dictionary | Explains every data field and what it represents in business terms. A heat chart highlights missing values so data quality issues are easy to spot. |
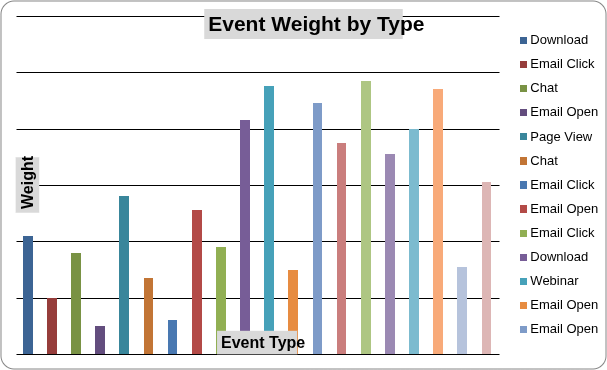
| Engagement_Events | Lists recent user actions like page views, email clicks, and webinar attendance. An event-weight chart shows which actions influence scores the most. |
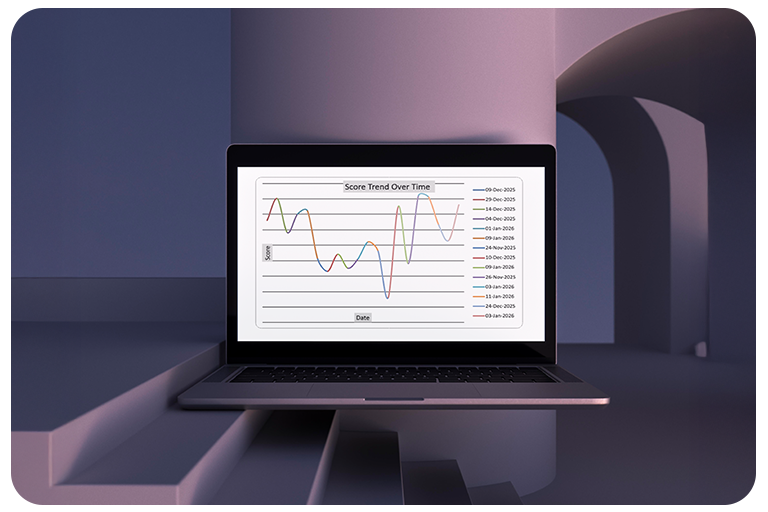
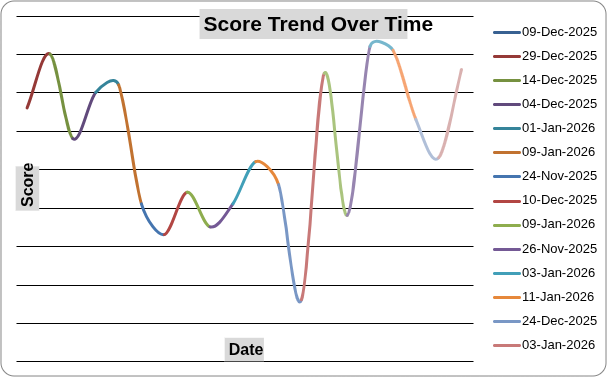
| Score_History | Plots how lead scores change over time for ongoing quality checks. This helps detect model drift and unexpected behavior early. |
Who will benefit most

Chief Revenue Officers and Growth Leads: Comprehending complicated data can be difficult for Chief Revenue Officers and Growth Leads who are responsible for the overall revenue growth and hitting sales targets. Their task is simplified with the help of an AI-based blueprint which offers ready-to-use features and a tested framework to track scores.
Sales Ops and RevOps teams: Marketing behavior may not reflect real sales outcomes. This can lead to clashes in marketing and sales teams. Hence this blueprint helps the Sales Ops and RevOps to bridge that gap and decide upon what actually works.
Data Scientists and MLEs: A lot of time goes into cleaning the bad data, setting up models, and building pipelines from scratch. This blueprint will act like a readymade notebook using which they can start the real AI work. They can start improving the model immediately, test new ideas, and speed up production.
Consultants and Fractional CMOs: Clients lose confidence when consultants come up with vague suggestions that don’t have real data to support the claims. This workbook helps the consultants to upload client data quickly, generate lead scores, and show data insights within days.
Investors and Board Members: Investors want to know the potential leads that are likely to convert. The size of the pipeline doesn't guarantee that sales will increase. This workbook helps them estimate real conversion probabilities, expected revenue from the pipeline, and whether the growth is healthy or inflated.
Click to download the free AI-driven lead scoring blueprint to generate lead scores and detect convertible leads in the pipeline.
*No email required.
Why this blueprint works
Prefilled with realistic engagement and PV samples: Instead of a blank dashboard, you will get a workbook that is already prefilled with sample website activities, email clicks, and PV values. A lot of time will be saved from cleaning the data, fixing formats, and figuring out the charts.
Built on 20+ years of MLM data-science know-how: This workbook helps MLM companies to track and analyze funnel activities such as page views, referral behavior patterns, and a sudden increase in volume.
Plug-and-play API spec: In many projects, plenty of effort goes into formatting and discussing APIs. An organized AI-driven lead scoring blueprint guides the developers on the data format to send, receive and where to write scores back into the CRM. DevOps team doesn’t have to figure out the fields, instead they can go straight into connecting the systems.
Mermaid and .ipynb starter: Flowcharts and diagrams are created with the Mermaid and the code, charts and model training steps are stored in a Jupyter notebook. They are collectively used to provide both technical and business teams with a clear picture of the workflow, so that it would be easier to re-establish and review.
Download a Free MLM AI-Driven Lead Scoring Blueprint to generate lead scores and feed leads back into your CRM for easy qualification.
*No email required.