
















English
- English
- Español

- 简体中文

- Français

- Deutsch

- Italiano

- 日本語

- 한국어

- Portuguese, International




Strategic analysis of unilevel, binary, and party plan incentives

Compensation plan structure in multi-level marketing changes over time. When the business expands and network demands increase, new layers get added to create a favorable structure. A bonus introduced to motivate early wins for new distributors or a seasonal incentive to boost sales or another surprise reward for a top performer, all of these are still the essential part of the basic compensation structure. But when structural changes that are small become plenty, leaders often lose track of the changes and end up adding an extra layer of complexity to the already existing complex structure.
The software companies in the sector have been experimenting for two decades to develop a complementing Incentive Compensation Management System (ICM). Large enterprises, especially the popular ones in SaaS, tech, and B2B services, have invested heavily in ICM platforms to efficiently manage and optimize sales commissions. These enterprises make their compensation decisions based on data analysis and past performance patterns together with financial forecasting. They work with standard compensation principles like payout caps, commission clawback for returns and reversals, and payout timings.
This white paper stresses on the need for the adoption of these ICM techniques into binary, unilevel, and party plan structures by direct selling and multi-level marketing companies even though the structure is more complex than that of enterprises. Compensation mistakes cause regulatory risks more than financial. Next to that stands investor confidence. The increasing supply chain expenses, foreign exchange rates, and return rates can negatively affect the revenue because commission paid on booked revenue can create a 3% gap against the actual profits realized.
Today, when the board, investors, and distributors demand transparency in how commissions are calculated, funded, and adjusted, manual or opaque processes don’t hold value. Through three major analytical tools, Commission Elasticity Curve (CEC), Overpayment Radar, and Stress-Test Tornado, this white paper will give direct selling companies the decision making power by helping identify the areas where commissions boost growth and where it drains profits.
Traditional commission management processes in direct selling can become a risk factor in itself if not properly managed. Three structural pressures are causing the traditional models to fail when the growth demands grow.
Earlier, direct selling companies paid commission for order totals even before they were delivered. Present day conditions deem this process to be inefficient because supply chain and packaging costs have increased together with customer behavior where returns and reversals rates are quite high. For international companies, where selling happens in Euros and fulfilled in Dollars further cuts profits due to unpredictable exchange rates and delivery complexity pressures.
When commissions are paid on order value without adjusting these external expenses, company does not gain, it loses profits. These are not considered as “cost of doing business”. Board and investors are keener on each expense because it directly affects risks and cash flow.
Every new strategy to uphold performance can create a new incentive. Over time, these incentives layer up to make the compensation design complex and lose its purpose. When the company creates new bonus systems without removing the old ones, payout number increases. At some point of time, the company may have introduced a rank achievement bonus based on personal volume, a global leadership pool bonus, product launch incentive, binary carry-over credit, or a SPIFF for an enrollment activity. The good intention of rewarding top performers or improving a market condition turn counterproductive when distributors feel that the incentives are random.
The risk runs deeper because in due course distributors realize SPIFFs as expected income, and the company will need to roll out additional payout for every new initiative.
The compensation system in B2B software companies is a modern framework, a self-sufficient financial system. These ICM platforms function on standard payout structures with a good control over caps and commission accelerators. Every payout is monitored and maintained to align with retention and recognition to balance the larger picture in the background, distributor motivation. Even a minor change in the compensation structure is tested and impacts studied before implementation.
When it comes to direct selling, many companies, even the ones with multi-level commission model, operate on traditional compensation platforms. These systems process payouts based on outdated rank structures and payout rules that are difficult to modify or audit. They cannot clearly explain ROI, detect market risks, or control operations at a level they are expected to be.
Hence, closing this efficiency gap is important to ensure long-term sustainability in an otherwise highly competitive and regulated industry like direct selling.
The basic concepts of ICM systems can work very well in the direct selling context too. The only important thing is to map each ICM practice to the specifics of binary, unilevel, and party plan models.
| Incentive design in ICM system vs direct selling | ||
|---|---|---|
| ICM | Direct selling | Strategic value |
| Base vs variable pay | Starter kits and enrollment benefits with variable retail and team bonuses | Reduces early customer acquisition costs and protects cash flow |
| Quota-attainment curve | Rank qualification ladder | Payout growth is aligned with performance |
| Accelerators and caps | Break-point bonuses and pool limits | Prevents sudden spikes in payouts during rapid rank promotions and market expansions |
| SPIFFs | Product launch and enrollment incentives | Goal-focused growth without altering compensation structure |
| Clawbacks | Return windows and chargeback periods | Protects profits and prevents abuse through rapid enrollments and returns |
In the ICM system, performers are rewarded based on a base pay and performance-based incentives. This same strategy is applied in direct selling too but in the form of fixed starter kits or enrollment benefits with variable retail and team bonuses. Designing a pay mix can help direct selling companies reduce their customer acquisition costs and protect cash flow during enrollment.
In B2B, sales teams earn more as they progress in their quota-attainment curves just as distributors who move up the rank qualification ladder in direct selling. These milestones show how payouts in both systems increase with performance.
Incentive Compensation Management systems apply caps to prevent overpayments and accelerators to reward exceptional performance. Break-point bonuses and pool limits manage this in direct selling. When these rules are carefully designed, the system can adapt to accommodate sudden commission spikes caused by an increase in market demand or faster rank promotions than expected.
SPIFFs adopted by enterprises are practiced as limited-time product launch bonuses or enrollment incentives in direct selling. Companies must set and strictly follow the timeframe for these short-term rewards to ensure the compensation structure is not altered for intermediate business demands.
ICM systems manage revenue risks caused by returns through commission clawbacks. The same protection is achieved by direct selling companies through predefined return windows and chargeback periods. This negates the abuse that can impact revenue through rapid order placements, enrollments, and cancellations.
ICM to direct selling translation rule
Attainment in ICM and rank qualification in direct selling are performance standards used to fix payout percentages. Commissions in MLM are based on a genealogy and in ICM they are paid based on team structures. When ICM has SPIFFs, MLM has short-term promotional incentives. When direct selling companies can match the concepts of the two models, they can start applying ICM analytics tools to improve accuracy and predictability in payouts.
The Commission Elasticity Curve (CEC) is a visual analytical tool that shows how much profit or contribution margin is generated for the commission a company pays. It is calculated in three detailed levels.

Individual orders
Individual representatives
Entire teams or network legs
The CEC helps companies identify the areas in the network where commissions motivate behavior and where they reduce or create negative returns.
Complete sales data with transactions over 12-month period and segmented by rank and channel is needed. The data should be of net sales, that is, gross sales minus returns, cancellations, and chargebacks.
Contribution margin is the gross margin minus all the sales-related expenses such as supply chain, promotional costs, and foreign exchange differences.
Analyze past sales patterns. Now, for each rank increase or decrease the payout percentage by 5 points and test the impact. Observe how profit per dollar paid changes with each test scenario.
Plot the results on the curve. The obtained CEC curve will show two particular regions. The steep zone where a small increase in payouts leads to big improvements in profits. Here, distributors respond to incentives and motivation is high. The flat zone shows little or no profits even with extra payouts because distributors are already motivated or cannot perform more.
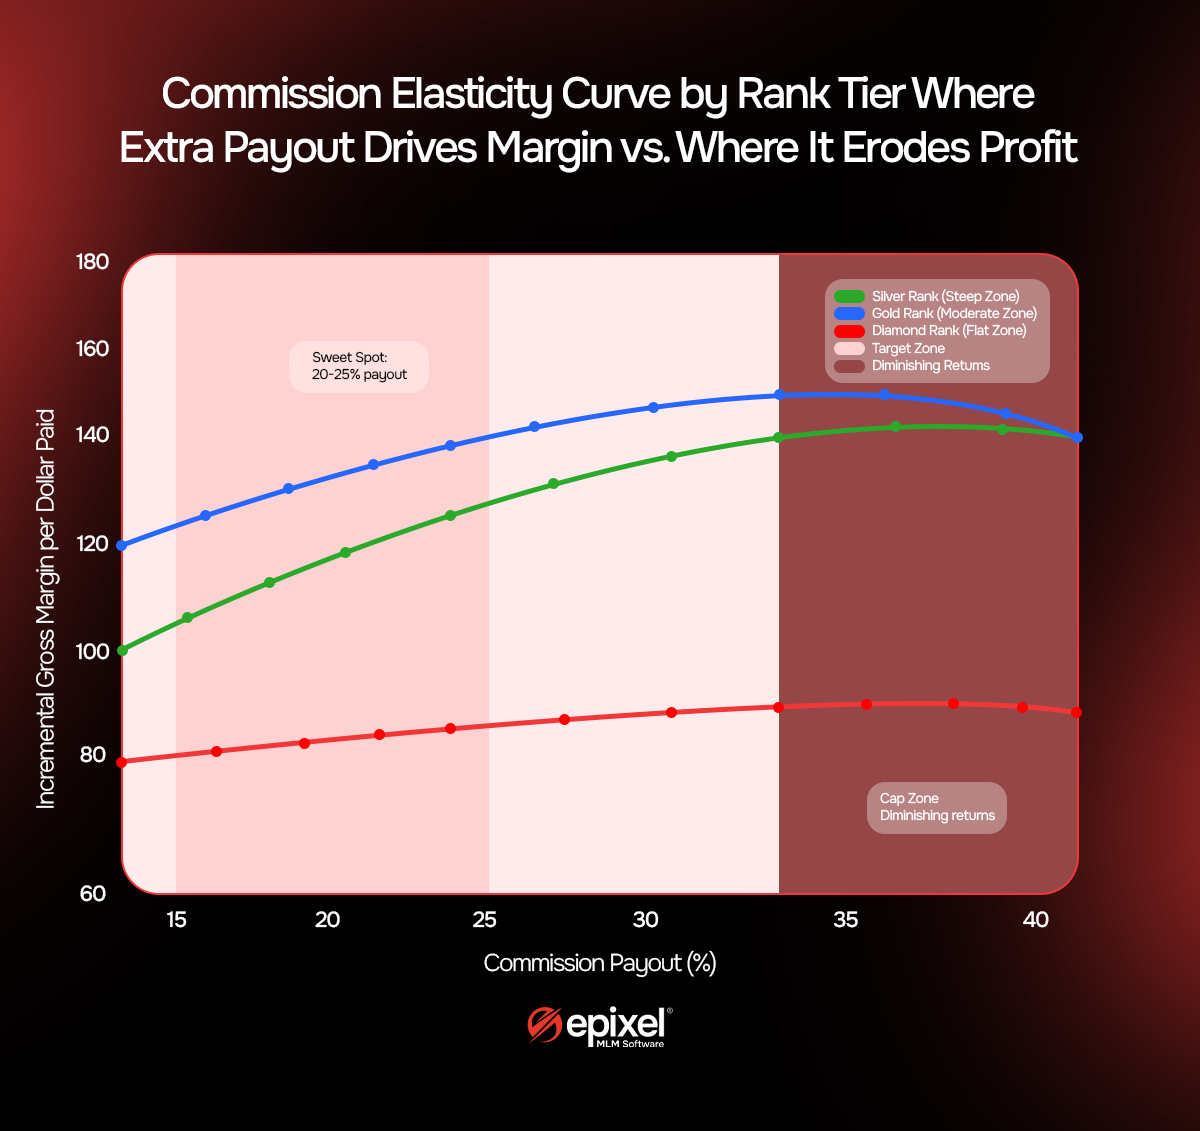
Decoding the Commission Elasticity Curve gives insights into optimizing the compensation plan. Focus on payouts in the steep zone where small payout increases present big profits. Apply cap or redesign tiers to reduce resource wastage than applying payout cuts everywhere.
Commission leaks and payout risks can exist even in the most well-designed compensations. The overpayment radar is a detection tool that identify leaks before they affect payouts and profits. It acts as a health scan for the compensation structure to identify five ways in which commission gets overpaid and scores them on a scale of 0-5. The scoring alerts companies as to which risk requires immediate attention.
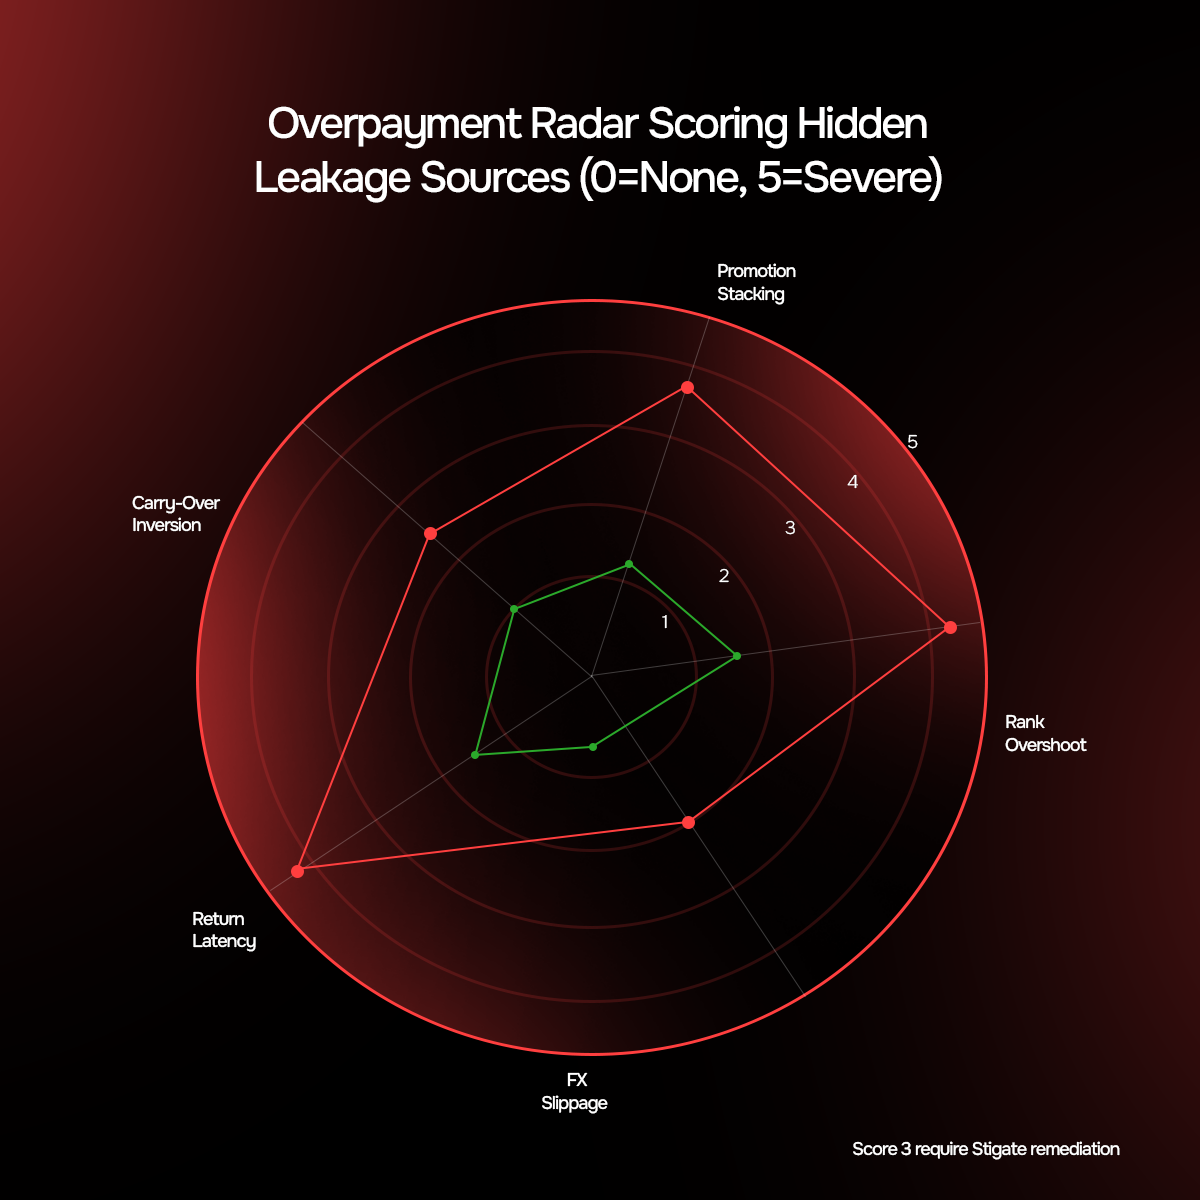
Sudden sales volume increase through bulk purchasing during a promotion or one large customer order can promote the distributor to the higher rank with higher commissions. After that, their sales performance drops to normal but continues to receive commissions based on the new rank which turns problematic for the company as they pay higher commission for average performance. Compensation plans in which rank protection rules delay demotions make the company lose margin through multiple payout periods.
An order placed by a distributor during a product launch promotion can be eligible for a rank bonus, pool bonus, launch incentive, and binary carry-over credit, all at the same time. Each bonus as such seems reasonable but the total effect can be well outside the company’s profit margin.
Binary plan rewards distributors for balanced growth across its two legs. But when the carry-over rules are poor, it can even reward imbalanced growth in binary genealogy where distributors grow one leg aggressively and neglect the other. When distributors see that increasing carry-over on their strong leg pays more than qualifying both the legs, the basic incentive principle of binary plan collapses.
Return latency is the timing gap between when commissions are paid and until when customers are still allowed to return products. Because if commissions are paid before the end of the return period, there are chances that the sales can reverse. Product categories with high return rates such as cosmetics, wellness, or seasonal products can create a 5-15% additional commission expense.
International direct selling companies with cross-country transactions on sales or payouts lose margin due to fluctuations in currency exchange rates. When this is not included in the compensation design, it increases payouts and taps profits.
The scoring system in the overpayment radar from 0 to 5 marks the severity of leakages. A score above 3 on any aspect is serious and requires immediate attention. The visual format of the overpayment radar makes it easier for leadership teams to quickly identify high priority risks and adopt strategies to counter their effect in real-time.
Compensation structures are built on assumptions. If enrollment grows by 10% and retention stays at 75% and if order size stays the same then commissions should be predictable. The fixed commission percentages with a set criteria work in normal business and market conditions but fail when real world conditions deviate from expectations.
Markets do not always stay the same. Enrollments can increase sharply during promotions, exchange rates can fluctuate unexpectedly, return rates increase when a product reformulation fails, or the whole genealogy changes when a leader departs with his downlines. These risks are not considered when designing compensations and leave the plan exposed when implemented in real-world markets.
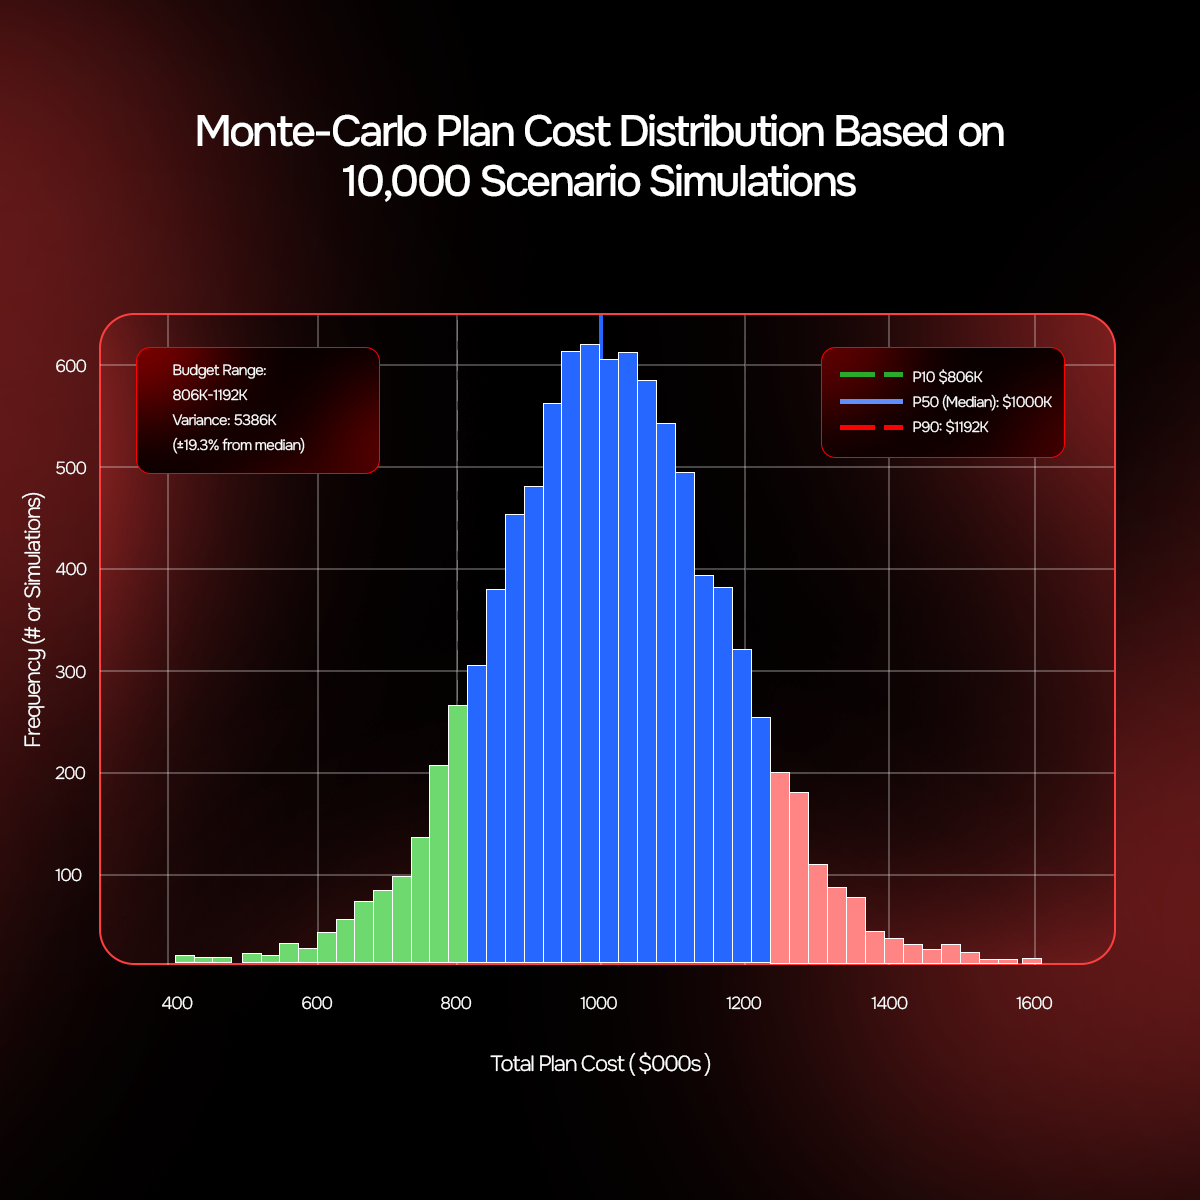
Monte-Carlo Simulation helps reduce these risks through scenario testing thousands of possibilities with past patterns. The patterns are randomly mixed and the plan is run 10,000 times. In direct selling, payout costs are influenced by six factors.
Return rate
Rank mix
Enrollment rate
FX rate
Balance of binary legs
Promotion uptake
Around 10,000 simulations are run with these factors using historical patterns to produce a probability distribution of total plan cost. The result ranging around P50 is the normal cost of the plan in normal circumstances, and P90 is the high cost but plausible downside scenario.
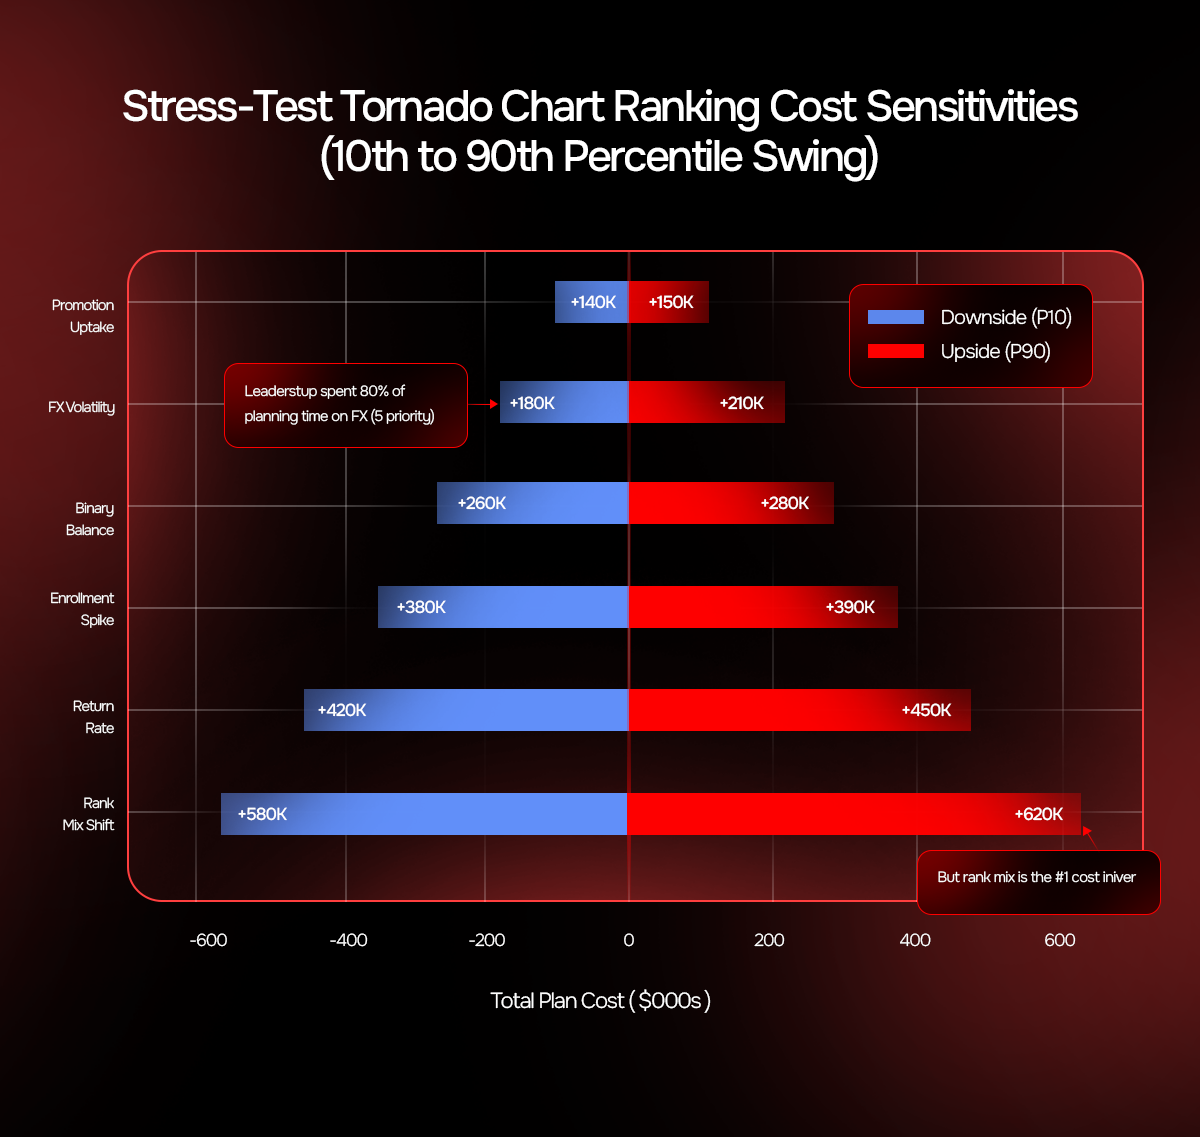
The Tornado Chart represents the outcomes of the simulations. The six factors are arranged on the basis of impact on plan costs. Each bar in the chart shows the variations that happen on the total cost when one variable moves from low to high and everything else stays the same.
Direct selling leadership can stress-test each variation to make smarter compensation design decisions by weighing the impact of each factor in each market.
Analytics tools are necessary when designing a compensation structure but governance is as important. Sudden compensation plan changes or inefficient rule limitations put the company in the danger of payout increase and compliance risks. Before implementing ICM system, direct selling companies must build strict policies for plan governance.
Commission caps decide how much commissions can be paid in extreme scenarios. If there are no caps in place, even small outliers can consume large portions of commission budgets. Caps can be applied at different levels like per order, per distributor per payout cycle, or per rank.
The caps should be set at the 95th percentile of historical payouts, which is high enough not to affect top performers and low enough to limit sudden unexpected spikes. Top performers do not approve caps because they expect unlimited rewards for their efforts. Caps can be set without hurting this top earner sentiments.
Companies can introduce “Elite Tracks” for top performers who consistently hit high targets for two to three payout periods. These cap-free tracks ensure top performers earn for their efforts but caps remain for distributors who hit higher sales target just once.
Cliffs are the minimum activity thresholds that distributors must meet to retain their rank. Absence of cliffs can endanger the payout system as the distributor who once secures the rank will continue earning indefinitely even after they turn inactive. This increases commission costs and affects the morale of active performers.
Rolling cliff is the best approach, also one of the widely implemented rank management approaches in direct selling. Rolling cliff mandates distributors to achieve the activity threshold at least twice in three months. This ensures flexibility and active contribution together with fairness in the commission structure.
Clawbacks are applied to reverse commissions when sales are not completed in the event of returns, chargebacks, or trial cancellations. When commissions are paid before the return period ends, distributors benefit but the company suffers. Clawbacks help recover these losses through short term commission pauses or complete commission reversals.
However, clawbacks have to be implemented without damaging distributor trust and company margins. When companies tend to deduct already paid commissions from future payout cycles, distributors react. Delaying commissions until the end of the return period creates a safer payout process with profits.
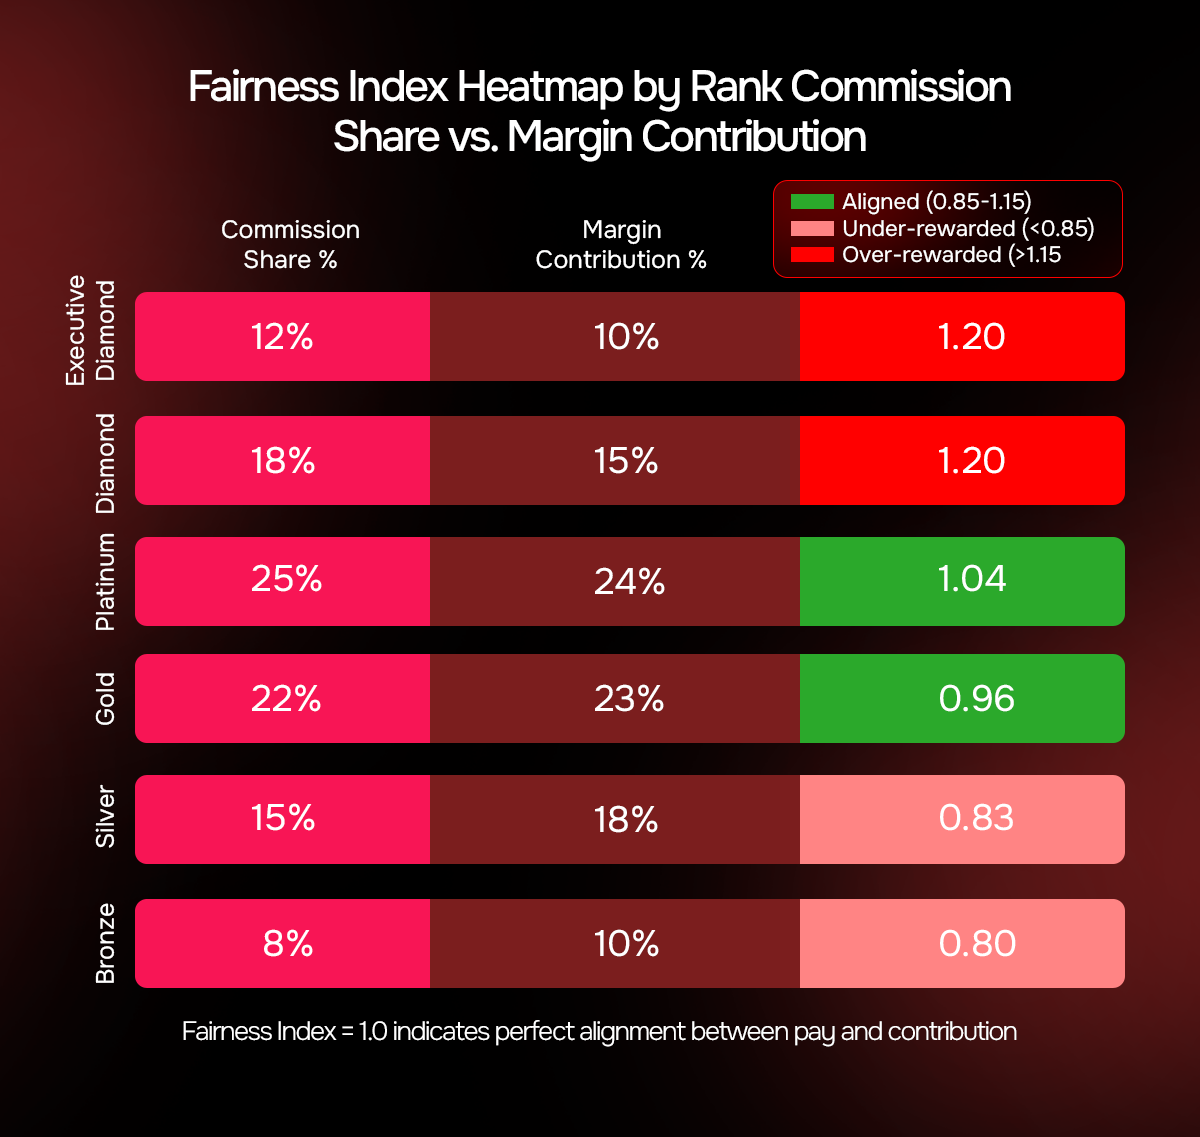
The Fairness Index is a metric to measure transparency in the payout process and it compares percentage of commissions received to percentage of margin contributed. When the compensation plan is aligned, a distributor earns 20% of commissions for the 20% margin he contributed. Any deviation from this standard is a serious case of overpayment or underpayment.
Fairness Index is a trust factor which shows distributors what they earn are for their contribution not for their tenure with the company or favoritism. Leadership team can rightly detect areas where the plan is underpaying emerging leaders or overpaying ranks.
In order to establish complete discipline in compensation practices, quarterly redline window is a must. It is a fixed period in the payout calendar during which payout changes can be proposed, discussed, and approved or rejected. Quarterly redline windows prevent plan changes in the middle of a cycle that confuse distributors and negatively impacts payout performance. However, short-term and promotional incentives can still be included in the plan any time. Only major changes to compensation structure like rank qualifications, payout percentages, and pool formulas are restricted with the redline window.
Incentive Compensation Management system is an enterprise framework which needs careful implementation. But it does not require years to build and implement. Focused strategies with the right leadership support and analytics, direct selling companies can turn existing compensation structure to a complete ICM system in 12 weeks.
| Week | Milestone | Output |
|---|---|---|
| 1-2 | Analyze current compensation structure and its past performance | Create Commission Elasticity Curve and Overpayment Radar by rank. |
| 3-4 | Draft rules to protect margin and fairness | Proposed caps, cliffs, clawback windows, and Fairness Index targets. |
| 5-6 | First version of Stress-test | Tornado chart that shows cost sensitivity and P50/P90 cost bands. |
| 7 | Test the plan with a select distributor group | Record distributor questions and confusion. Document recommended clarification. |
| 8-9 | Finalize and document the plan | Locked payout bands, policy manuals, and materials for distributor communication. |
| 10-12 | Approval from the board and complete rollout | Commission calculator that shows how commissions are calculated with the new plan, training workbook, and details of governance team and their responsibilities. |
This is a feasible implementation plan for direct selling organizations of any size. Delay that might be encountered will mostly be in the initial weeks when data quality issues arise. Also, if distributor feedback demands more clarifications, Week 7 plan might slightly get delayed. Buffer time allotted early in the process can reduce delays or operational disruptions in the middle of the implementation process.
When the plan is final and rolled out across the network and all international markets, it needs continuous monitoring. The following set of high priority KPIs should be tracked monthly and reviewed by the board to ensure detection of risks early and for consistent plan performance.
| KPI | Target Band | Importance |
|---|---|---|
| Plan cost percentage of net sales | Within the limitation as set during compensation design | Primary profit control. Any deviations indicate execution issues, aggressive promotions, and market shifts. |
| Contribution margin (Pre/post compensation) | Rising every year | Checks if plan adds value. Rising margins confirms that incentives are motivating profitable behavior and declining margins hint at incentives rewarding volume than value. |
| Payout variance vs model | ±3% monthly | Indicates calculation errors, system bugs, or undocumented plan changes. |
| Rank attainment stability | ≥70% 3-month persistence | Detects distributors abusing the system with sudden volume increases and qualification criteria that are hard to achieve or inefficient. |
| Promotion overlap | <10% of orders | Limits promotion stacking. High overlap can cause overpayment, profit loss, and unintended incentive stacking. |
These five KPIs can be visualized on a single dashboard that is updated in real time with data from the commission system. The metric performance can be presented to the board for a 20 minute review every quarter. This will ensure that the compensation plan is efficient and reduces queries and disputes in the process.
Mainly three types of objections surface during ICM implementation in a direct selling business. Preparing to handle them beforehand can help boost distributor trust and executive approval.
If top performers see a limitation to their earnings, they may contribute less or choose a competitor. Caps do not act as a demotivator when set correctly. Elite tracks can handle these objections with flexible cap limitations. In reality, only few distributors reach the cap threshold and for the rest the cap is not visible at all. For the top performer few, this cap will turn into a recognition of excellence.
Some binary MLM organizations consider indefinite strong leg carry-overs as a recognition to distributor efforts. It is embedded into their organization’s reward culture. They fear any deviation of this can cause disengagement in the field. But rewarding unprofitable behavior can impact the sustenance of the business in the market when the unexpectable strikes.
A compromise strategy can be applied to counter the objection by balancing incentives on each leg. Balancing the legs, that is, if the volume on one leg is never less than 60% of the other, then the distributor receives an extra recognition with a commission increase of 10-20% during that payout period. This way, the binary MLM company can keep their distributors motivated and avoid imbalanced binary structures.
Competition and opportunities can strike at any minute and for the same reason marketing teams do not approve the quarterly redline window strategy. In case a competitor launches a promotion during the middle of the quarter, waiting to respond until the next redline window can result in losing the opportunity and market share.
But quarterly redline windows are, however, flexible to introducing short-term incentives. So, marketing teams can launch SPIFFs when the need arises and reserve core plan changes for the quarterly redline window.
Now is the era of smarter compensation, a profitable and predictable one that is built on analytical conclusions. The ICM strategy in direct selling will address the structural disadvantages of a traditional compensation management system with flexible compensation strategies that can be easily mapped to the current binary, unilevel, or party plan structures. ICM in direct selling will enhance distributor-brand experience with transparent payout processes and fair compensation standards.
Direct selling industry has always been open to changes and development in the realms of product innovation, market expansion, and distributor experience. The same spirit when applied to compensation design can bring predictability and profitability in the growth of the organization and their distributor network.
Epixel MLM Software anchored 450+ network marketing companies to success through their business process automation in more than 88 countries. Let Epixel MLM Platform revolutionize your MLM business with 100+ proven features intelligently tuned for small, medium, and large enterprises.
Try our Ultra-modern
Direct Sales Mobile App!!!
Take your business with you. Anytime. Anywhere.


Epixel Enterprises LLC.
300 Delaware Ave STE 210 286,
Wilmington, DE 19801
United States Of America
Solutions
Products
Resources
Get in touch
Epixel Enterprises LLC.
300 Delaware Ave STE 210 286,
Wilmington, DE 19801
United States Of America
 United States+1 650 491 9744



 Canada+1 437 2208998
 Mexico+52 13322545528
 Hong Kong+852 5616 7921