Download free commission risk calculator template for MLM distributors

Are you tuning or designing an MLM or direct selling compensation plan? Are you uncertain if payouts can be maintained or how commission risk caps and bonuses can contribute to your margins? The Commission Risk Calculator template provides you with a first perspective of payout sustainability and possible risks.
This Excel workbook is a 100% formula-based workbook (no macros). It is also filled with 12 months of realistic sample data to get going with the analysis. Enter your sales and commission data, and the workbook will work out payouts, impose caps and present risk measures in easy-to-understand dashboards. Maintain sustainable commission payouts and learn potential risks which will guide you through the decision-making process.
Learn how you can maintain a consistent compensation plan using this free commission risk calculator
*No email required.
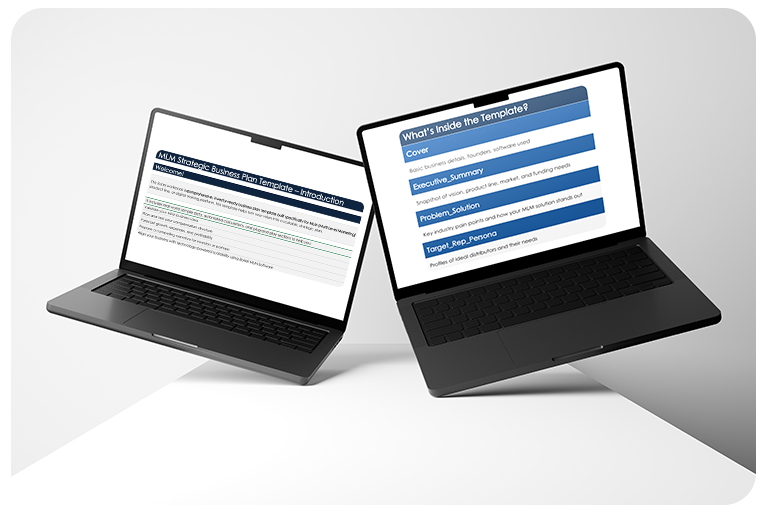
What's inside the commission risk calculator template
| Tab | Purpose |
|---|---|
| ReadMe | It is a one-page guide that describes the workflow, including the inputs, data, and summary of actions. It also has a glossary to help new users understand the concepts within a short time. |
| Inputs | Set target, amber or red flags, P or S thresholds, COGS %, other variables, fixed overhead, cap per distributor, top 10 threshold, and commission rates by type. Includes scenario controls (rate factor, cap adjustment). |
| SalesData | Enter transaction-level information, including date, distributor, sales, and type of commission. Commission calculations are made automatically via formulas. |
| ByDistributorMonth | Distributor payments are accumulated month by month up to a limit. This perspective puts emphasis on payout concentration and counts cap breaches. |
| MonthlySummary | Evaluate the net sales, capped and uncapped payouts, payout-sales ratios, contribution margins and the break-even sales month by month. Inbuilt charts indicate obvious trends with time. |
| RiskFlags | A basic dashboard is used to show payout ratios, concentration, margins, and risk warnings. It is meant for quick reviews by executives. |
| Caps_BreakEven | Provides the most recent month of cap changes, payout ratios, margins, break even sales, and the number of cap violations. This snapshot simplifies the process of following up on real-time risks. |
| Scenarios | Sliders and presets allow testing the modification of such parameters as tightening caps, reducing commission rates, or introducing promotions. Findings are updated immediately on all tabs. |
| DataDictionary | Definitions in plain English of metrics and formulas. This creates trust and makes everyone interpret the figures in the same way. |
| Optional Add-ons | These add-on tabs provide further details to the fundamentals: An executive dashboard to provide executives with a clear overview of team performance, a cap breach log to monitor excessive spending, and concentration and fairness indicators to ensure that payouts are balanced. They have a refunds trend to track returns, liquidity, and cash forecast to schedule cash requirements, and ensure stability. |
The general purpose of the sheet is to provide financial insights and manage compensation plans. It helps leaders at the forefront to measure payout risk, protect margin, and decide cap or rate changes with confidence.
Know what each core section unlocks
Inputs (control center): Specify your expenses, payout markers, and security levels to lead the plan.
Data (ground truth): Enter raw sales transactions and the sheet will automatically calculate commissions.
Aggregation (reality check): Sum up the payouts per distributor per month and use caps properly.
Summary (story): See important metrics, by month: Payout-to-sales ratio (P/S), margins, break-even, and concentration.
Scenarios (action): Change the commission rates or caps and immediately view the financial effect.
Why is this not a basic excel sheet
Real plan math: The template uses distributor-level commission limits on a monthly basis rather than globally. This makes payouts more realistic based on the real-world compensation policies.
Risk at a glance: It automatically puts payout-to-sales ratios and top-seller concentration under green, amber, and red flags respectively. Leaders can immediately see whether the plan is imbalanced or not.
Profit clarity: It determines a clear break-even level of sales by adding costs and commission payouts. This can give you a picture of the exact sales required to be considered profitable.
No-macro scenarios: Simple rate and cap adjustment sliders allow you to experiment with policy changes within seconds. It does not require any coding or macros to visualize the effect.
Board-ready charts: Inbuilt charts compare sales to payouts and monitor the changes in payout ratios with time. These images are available to distribute among executives or investors.
Who will it benefit the most
C-suite (CEO/CFO/CRO): Executives will receive a clear overview of the sustainability of commission payouts at a high-level. It identifies profit guardrails and risks that they require to make decisions.
Compensation and finance: The teams can plan and amend commission regulations with confidence. The template will assist them in simulating the situation and supporting their decisions using data.
RevOps or sales ops: Operations departments will be able to monitor quotas, incentives, payout limits in a more effective manner. This guarantees equitable and steady payouts and prevents excessive spending.
Analytics and FP&A: Analysts will be able to track trends, detect anomalies and make correct financial statements. It enhances prediction and risk control.
Common use cases
Plan tuning: The template compares the actual ratios of payout to sales and checks them against your targets. The plan can be optimized by testing various cap levels or commission rates.
Cash-flow defense: It puts emphasis on those months that have exceptionally high payouts or cap violations. This is to protect the company’s cash flow.
Promo planning: You are able to simulate the effect of short-term bonuses or promotional investments. This will keep growth incentive-based without cutting margins.
Board reporting: RiskFlags presents a data-based, straightforward account of risk-related topics to the leadership. Both the risks and the reasons behind the changes are perceived by the executives.
Fairness or compliance: The tool monitors payout concentration among vendors and qualification requirements. This is to ensure that there is fairness within the regulations.
How to use it in 5 steps
Open Inputs: Add your target ratios, cost, and payout caps per distributor. This provides guardrails for all calculations.
Paste SalesData: Enter your sales at the transaction level with the necessary headings. Commissions will be computed automatically in the sheet.
MonthlySummary Review: Payout-to-sales ratios, contribution margin, break-even sales. This demonstrates profitability on a monthly basis.
Check RiskFlags: Visit traffic-light signals and top 10 payout share. Search for red or amber signals to identify the risks in time.
Toggle Scenarios: Sliders to change commission rates or caps. Immediately view the impact of these changes on any report.
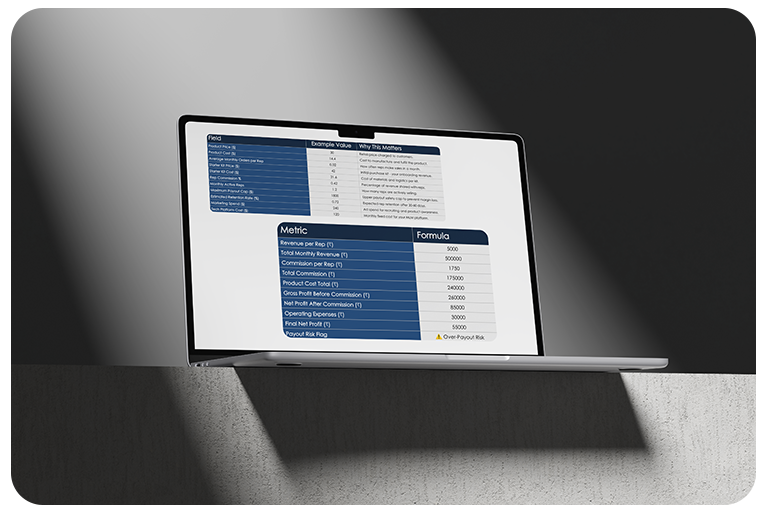
Metrics & formulas (built-in)

Payout-to-Sales (P/S): Total Commission ÷ Net Sales.
Contribution Margin: 1 − (COGS% + Other% + P/S).
Break-even Sales: Fixed Overhead ÷ Contribution Margin.
Top 10 Payout Concentration: % of capped payout earned by top 10 distributors.
Payout-to-Sales (P/S): Measures what percentage of sales is being paid out as commissions.
Contribution Margin: Measures how much of sales are left after covering costs and commissions.
Break-even Sales: The sales volume needed to cover fixed overhead without losses.
Top 10 Payout Concentration: The share of total commissions earned by the top 10 distributors.
Why will this template work
Prefilled with 12 months of real-life sample data: The template is ready to use on the first day with application examples. This would teach you the reasoning behind adding your numbers.
Simulates real compensation mechanics: It implements real-life rules of commission such as caps, payout mixes, and timing. This brings the results closer to those that occur in practice.
Constructed on best practice: The model is based on established direct selling concepts. It has equally been tested against the standard principles of finance to be reliable.
Offline, safe, and interpretable: It is all formulas with no hidden macros. That implies that it is open, secure to share, and auditing becomes effortless.
Use practical formulas to fix commission payouts and identify risk factors.
*No email required.
Finding it difficult to maintain a sustainable compensation payout plan and in calculating cap risks? Contact our Risk Analysis Expert
Frequently Asked Questions
Yes. The table on Commission Rates is editable to suit unilevel, binary, faststart bonus, or any other compensation plan.
Yes. Every value is numerical, and you can refresh the currency label in the Inputs tab to report.
Yes. Any modification of rate factor or cap adjustment reflects on all rollups, summaries, and risk flags automatically.
Just use the COGS% and Other% in the Inputs tab. The calculations of the contribution margin and break-even will be automatic.